A single entry point for 11 categorical chart types: bar, rose, ring, pie, trend, area, dot, sankey, chord, venn, and upset.
Usage
plt_cat(
  data,
  stat.by,
  group.by = NULL,
  split.by = NULL,
  type = c("bar", "rose", "ring", "pie", "trend", "area", "dot", "sankey", "chord",
    "venn", "upset"),
  stat = c("percent", "count"),
  position = c("stack", "dodge"),
  palette = NULL,
  alpha = 0.8,
  label = FALSE,
  label.size = 3.5,
  label.fg = "black",
  label.bg = "white",
  label.bg.r = 0.1,
  bg.by = NULL,
  bg_palette = NULL,
  bg_alpha = 0.15,
  flip = FALSE,
  NA_color = "grey80",
  NA_stat = FALSE,
  keep_empty = FALSE,
  stat_level = NULL,
  title = NULL,
  subtitle = NULL,
  xlab = NULL,
  ylab = NULL,
  legend.position = "right",
  legend.direction = "vertical",
  aspect.ratio = NULL,
  facet_nrow = NULL,
  facet_ncol = NULL,
  facet_byrow = TRUE,
  base_size = 14,
  force = FALSE,
  ...
)
Arguments
- data
A data frame (or Seurat object metadata).
- stat.by
Character. Column name(s) for the categorical variable to summarise. For standard types (bar, rose, ring, pie, trend, area, dot) a single column name. For set types (sankey, chord, venn, upset) a character vector of >= 2 column names.
- group.by
Character. Optional grouping variable for standard types. Ignored for set types.
- split.by
Character. Optional splitting variable. Splits data, creates one plot per level, and combines with patchwork.
- type
Chart type. One of
"bar","rose","ring","pie","trend","area","dot","sankey","chord","venn","upset".- stat
Statistic to compute:
"percent"(default) or"count".- position
Bar position:
"stack"(default) or"dodge".- palette
Colour palette. One of:
NULL(default): usespal_lancet.A single string matching a name in
palette_list: usespal_get().A character vector of colours: used directly.
- alpha
Numeric 0–1. Colour transparency. Default 0.8.
- label
Logical. Show value labels? Default
FALSE.- label.size
Numeric. Label text size. Default 3.5.
- label.fg
Character. Label foreground colour. Default
"black".- label.bg
Character. Label background colour. Default
"white".- label.bg.r
Numeric. Label background corner radius. Default 0.1.
- bg.by
Character. Column name for background grouping in dodge mode. Must be a superset of
group.by(each group.by level belongs to exactly one bg.by level). Adds alternating background colour bands. DefaultNULL(no background).- bg_palette
Character vector of background band colours. Default
NULLuses alternatingc("grey85", "transparent").- bg_alpha
Numeric 0–1. Background band transparency. Default 0.15.
- flip
Logical. Flip coordinates for bar type? Default
FALSE.- NA_color
Character. Colour for NA values. Default
"grey80".- NA_stat
Logical. Include NA in the frequency table? Default
FALSE(NAs are dropped). IfTRUE, NAs are kept and shown withNA_color.- keep_empty
Logical. Keep empty factor levels in plots? Default
FALSE.- stat_level
Character or list. For venn/upset types, the value(s) in each
stat.bycolumn that count as "positive". DefaultNULLauto-detectsTRUE,"Yes","yes",1,"TRUE","1", or uses the first factor level.- title
Character. Plot title. Default
NULL.- subtitle
Character. Plot subtitle. Default
NULL.- xlab
Character. X-axis label. Default
NULL.- ylab
Character. Y-axis label. Default
NULL(auto-set based onstat).- legend.position
Legend position:
"right"(default),"left","bottom","top", or"none".- legend.direction
Legend direction:
"vertical"(default) or"horizontal".- aspect.ratio
Numeric. Panel aspect ratio. Default
NULL(auto). Automatically set to 1 for rose, ring, and pie types.- facet_nrow
Integer. Number of rows when combining split panels. Default
NULL(auto).- facet_ncol
Integer. Number of columns when combining split panels. Default
NULL(auto).- facet_byrow
Logical. Fill split panels by row? Default
TRUE.- base_size
Numeric. Base font size for
theme_my(). Default 14.- force
Logical. Force plotting when variables have > 100 levels? Default
FALSE.- ...
Additional arguments passed to the type-specific plot function.
Note
Set types require additional packages:
sankey: ggsankeychord: circlizevenn: ggVennDiagramupset: ggupset
See also
Other plot:
PlotButterfly(),
PlotButterfly2(),
PlotRankCor(),
plt_cohen(),
plt_con(),
plt_dist(),
plt_radar(),
plt_sankey(),
plt_upset()
Examples
set.seed(1)
df <- data.frame(
Type = factor(sample(c("A","B","C"), 200, TRUE)),
Group = factor(sample(c("X","Y","Z"), 200, TRUE)),
Batch = factor(sample(c("B1","B2"), 200, TRUE))
)
df$Region <- factor(ifelse(df$Group %in% c("X","Y"), "R1", "R2"))
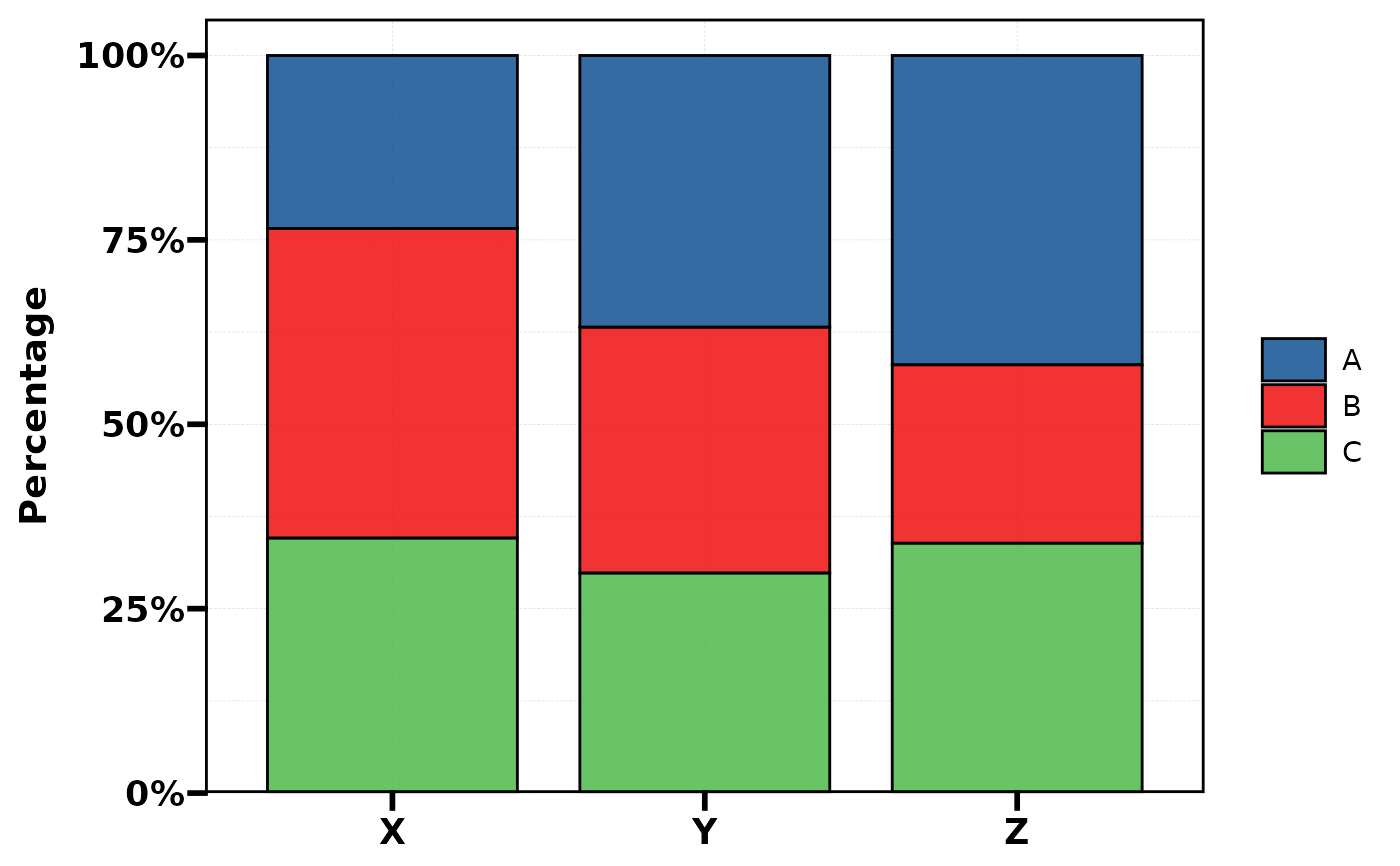
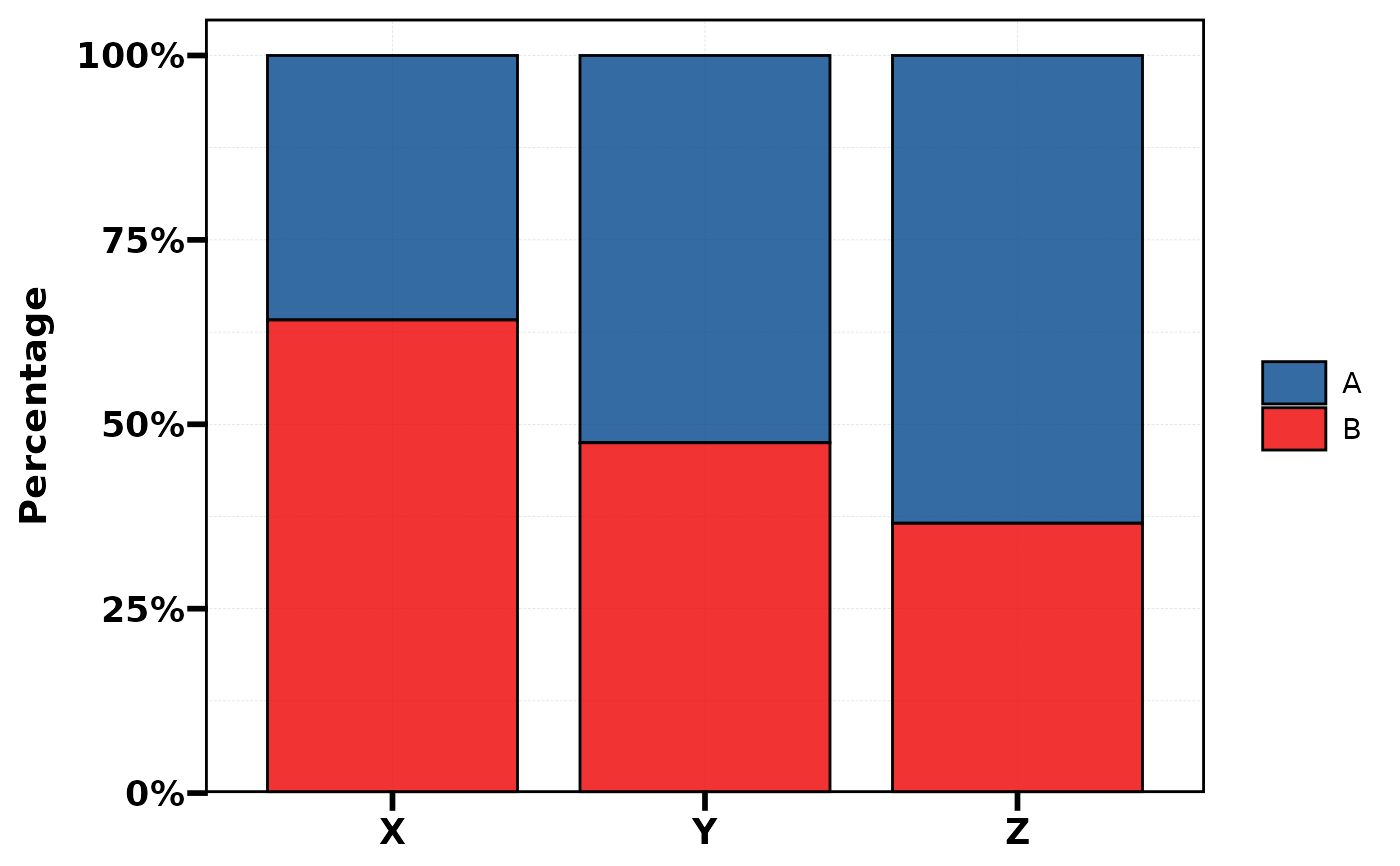
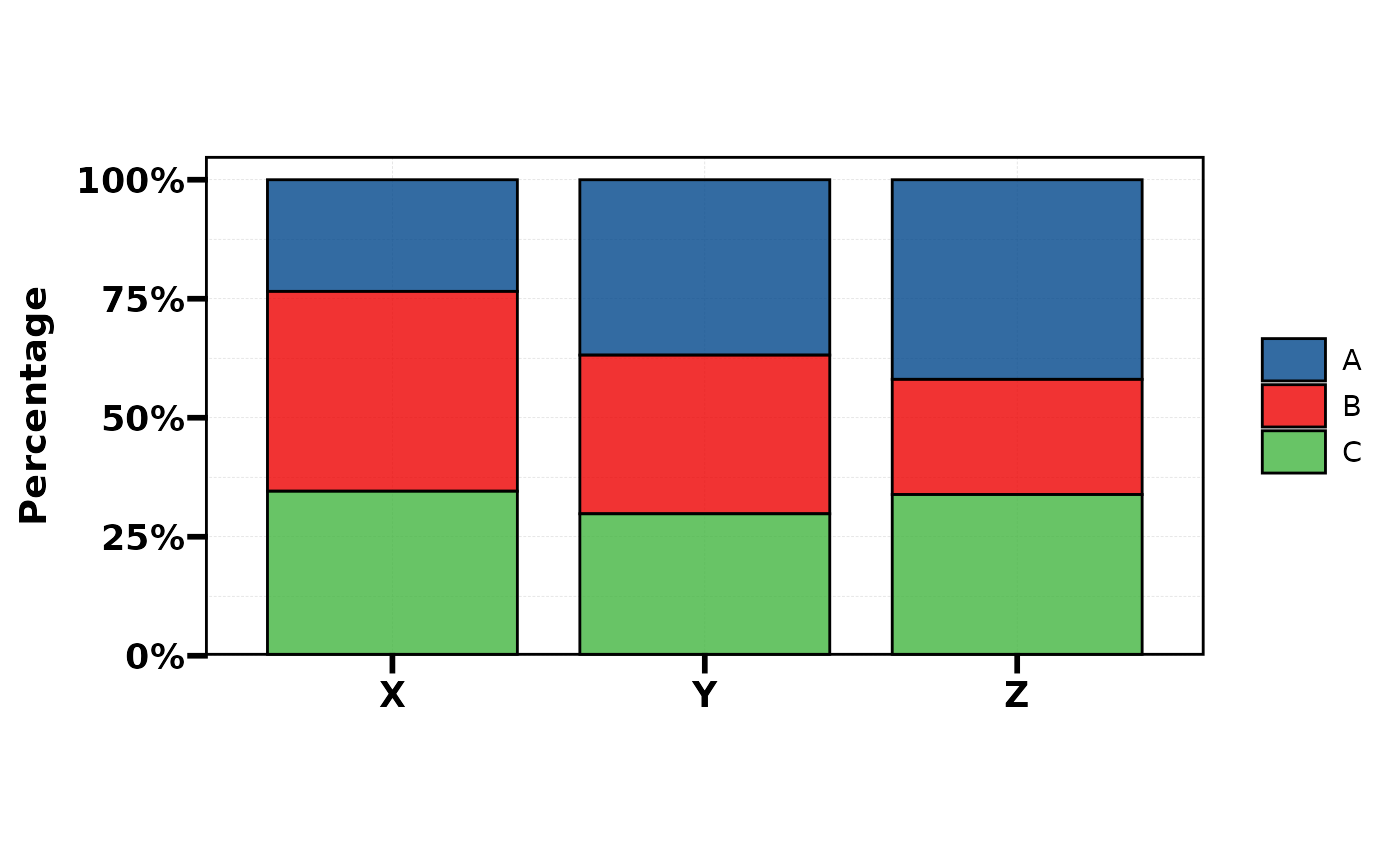
# ===== 1. Bar =====
plt_cat(df, "Type", "Group", type = "bar") # stacked %
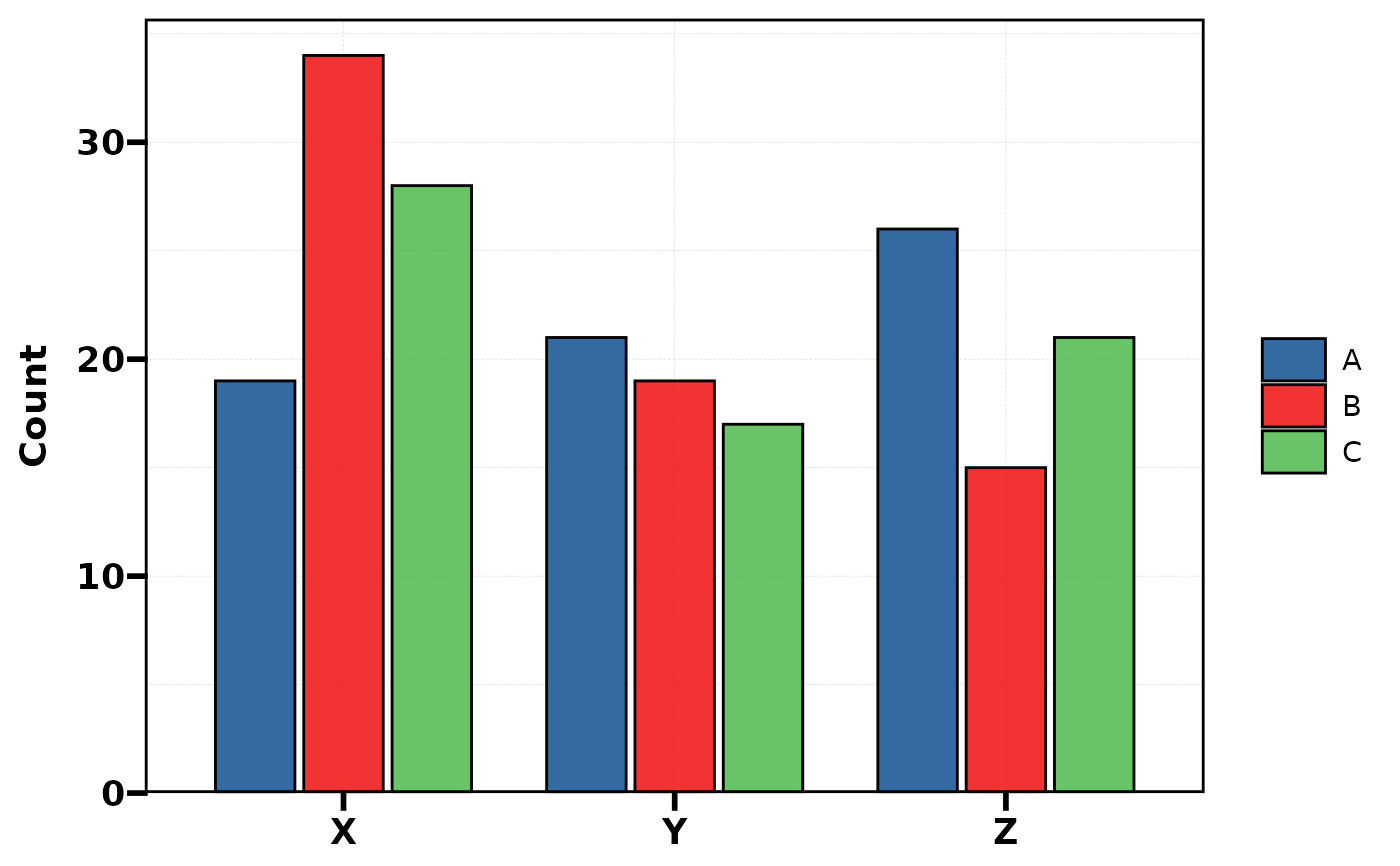
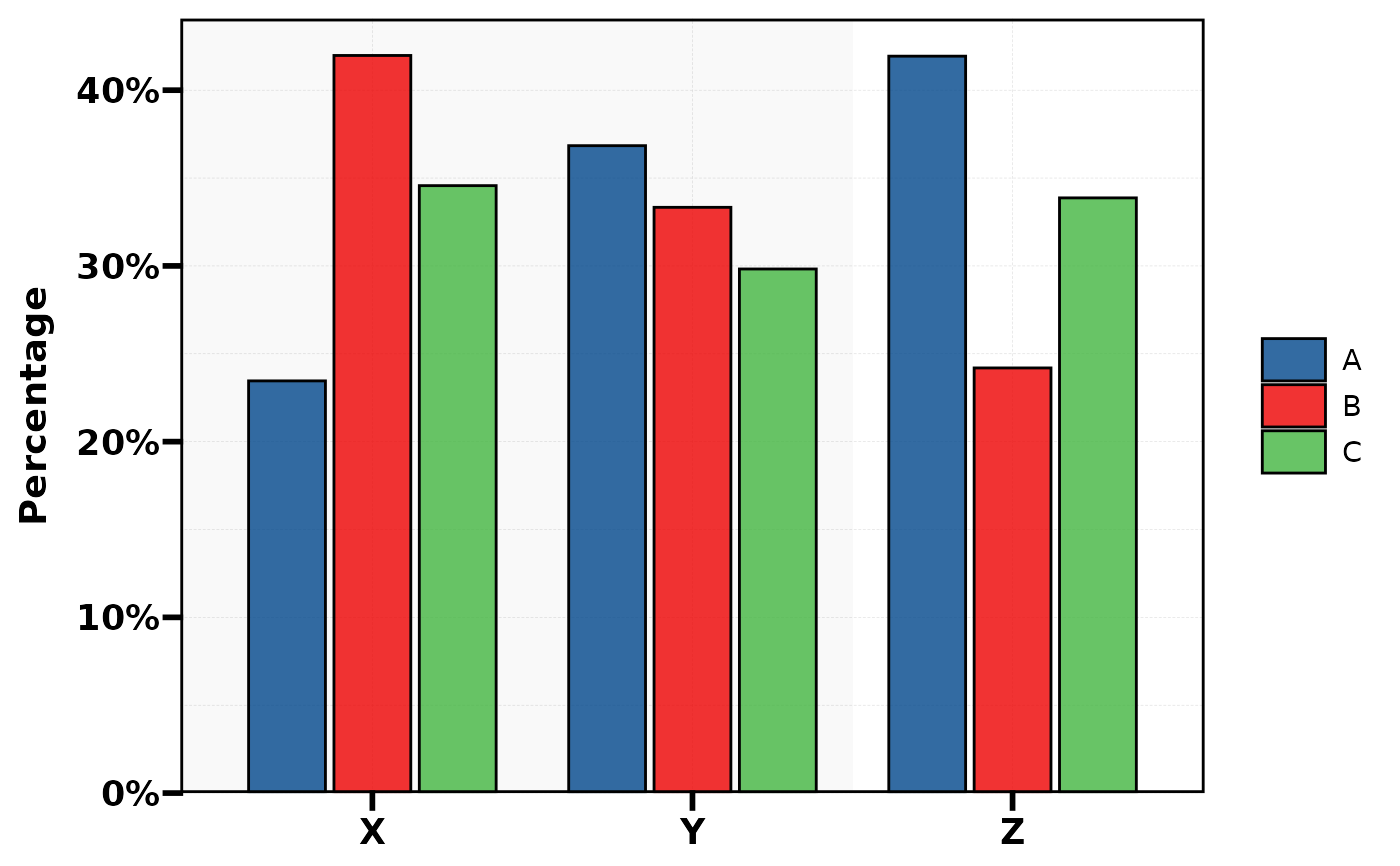
 plt_cat(df, "Type", "Group", type = "bar", stat = "count",
position = "dodge") # dodged count
plt_cat(df, "Type", "Group", type = "bar", stat = "count",
position = "dodge") # dodged count
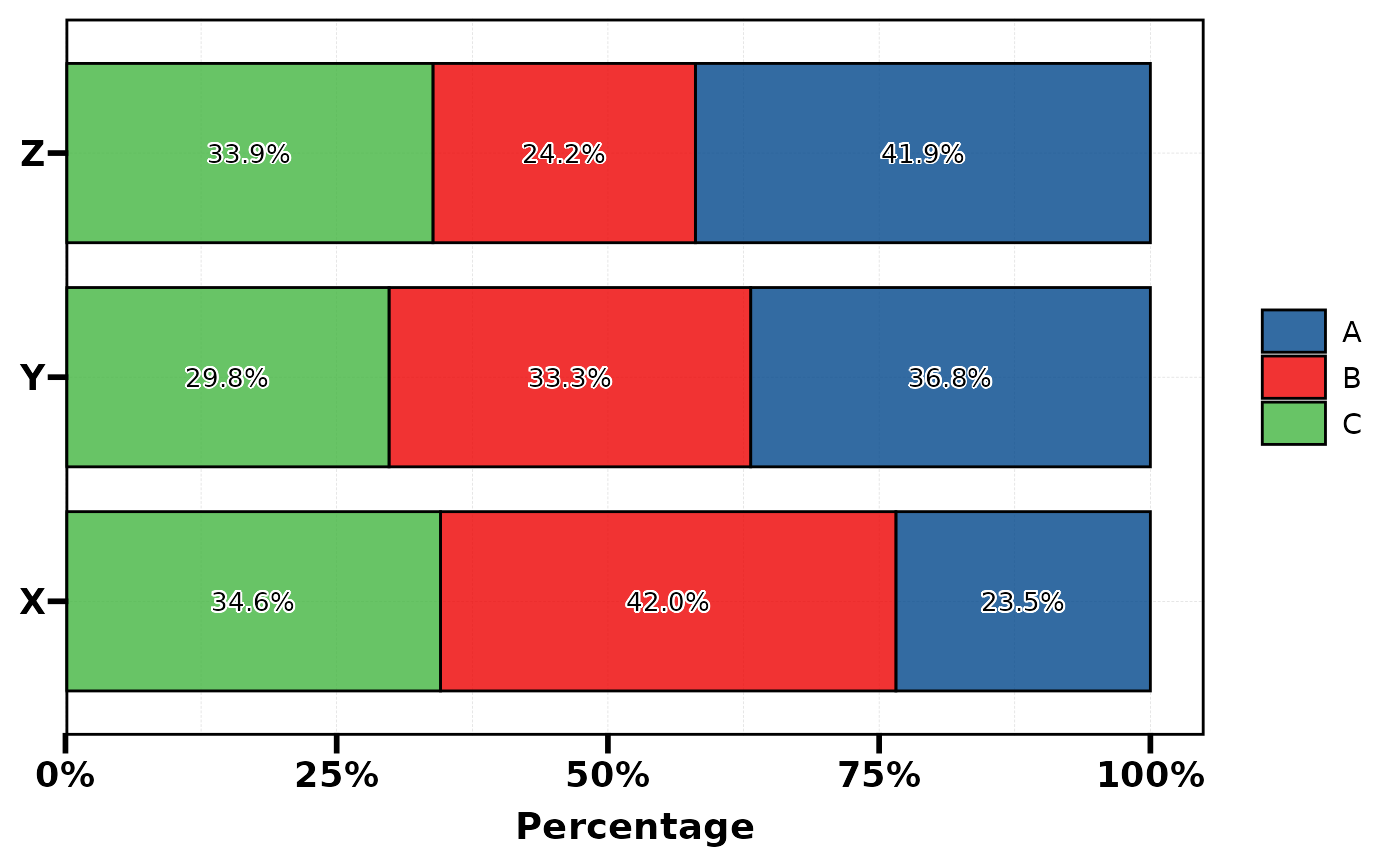
 plt_cat(df, "Type", "Group", type = "bar", flip = TRUE,
label = TRUE) # flipped + labels
plt_cat(df, "Type", "Group", type = "bar", flip = TRUE,
label = TRUE) # flipped + labels
 plt_cat(df, "Type", "Group", type = "bar", position = "dodge",
bg.by = "Region") # background bands
plt_cat(df, "Type", "Group", type = "bar", position = "dodge",
bg.by = "Region") # background bands
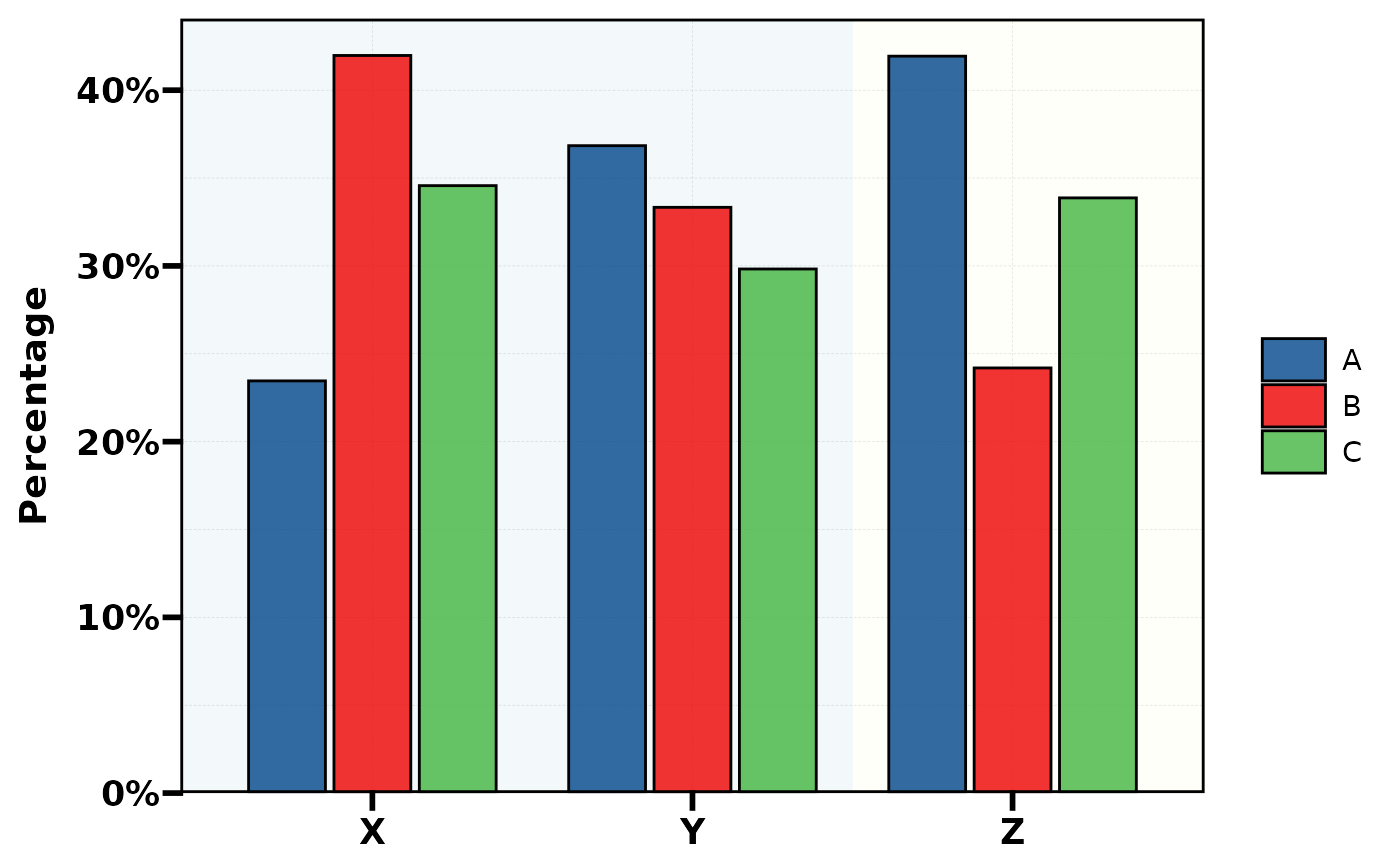
 plt_cat(df, "Type", "Group", type = "bar", position = "dodge",
bg.by = "Region",
bg_palette = c("lightblue", "lightyellow")) # custom bg colors
plt_cat(df, "Type", "Group", type = "bar", position = "dodge",
bg.by = "Region",
bg_palette = c("lightblue", "lightyellow")) # custom bg colors
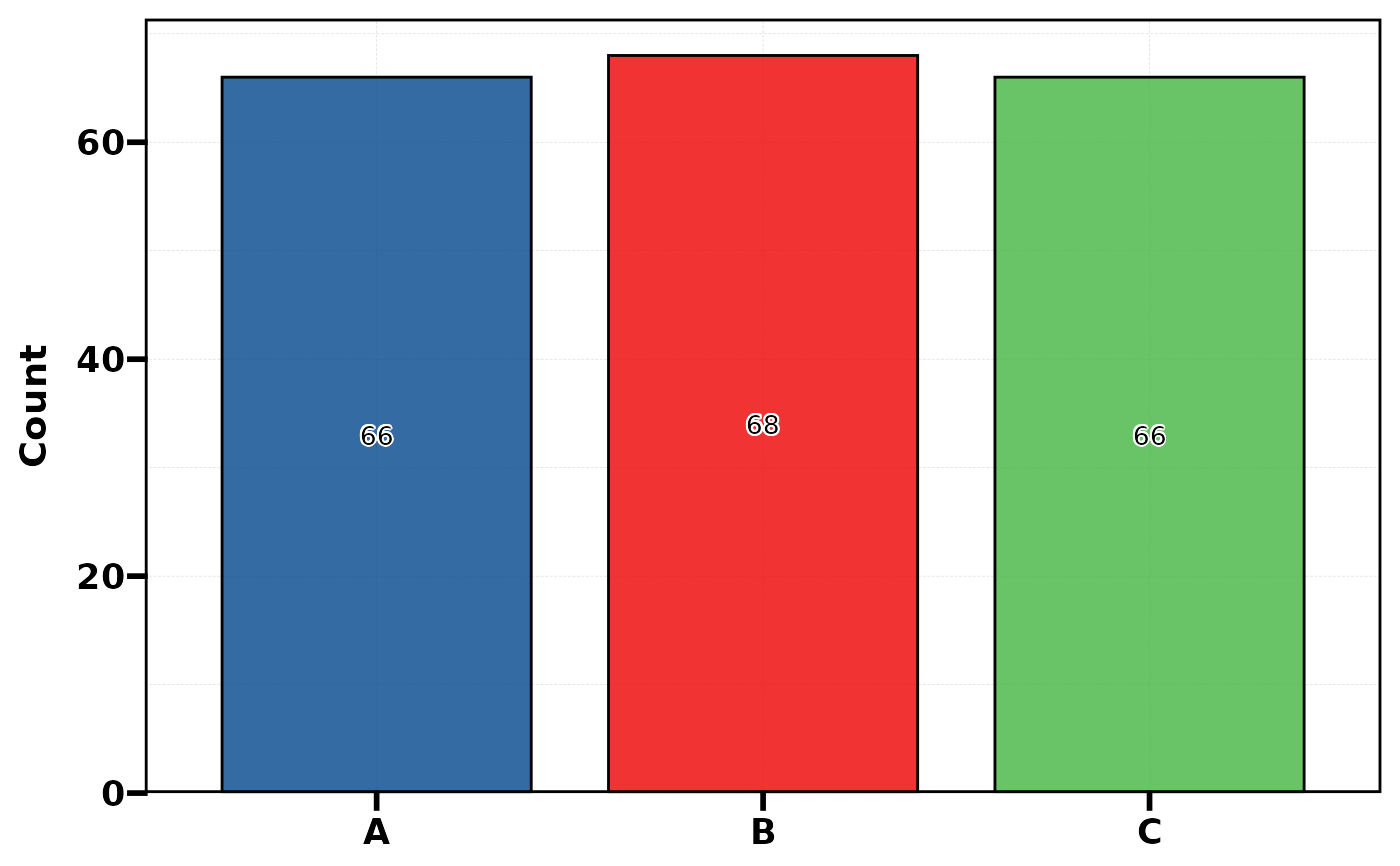
 plt_cat(df, "Type", type = "bar", stat = "count",
label = TRUE, legend.position = "none") # no group
plt_cat(df, "Type", type = "bar", stat = "count",
label = TRUE, legend.position = "none") # no group
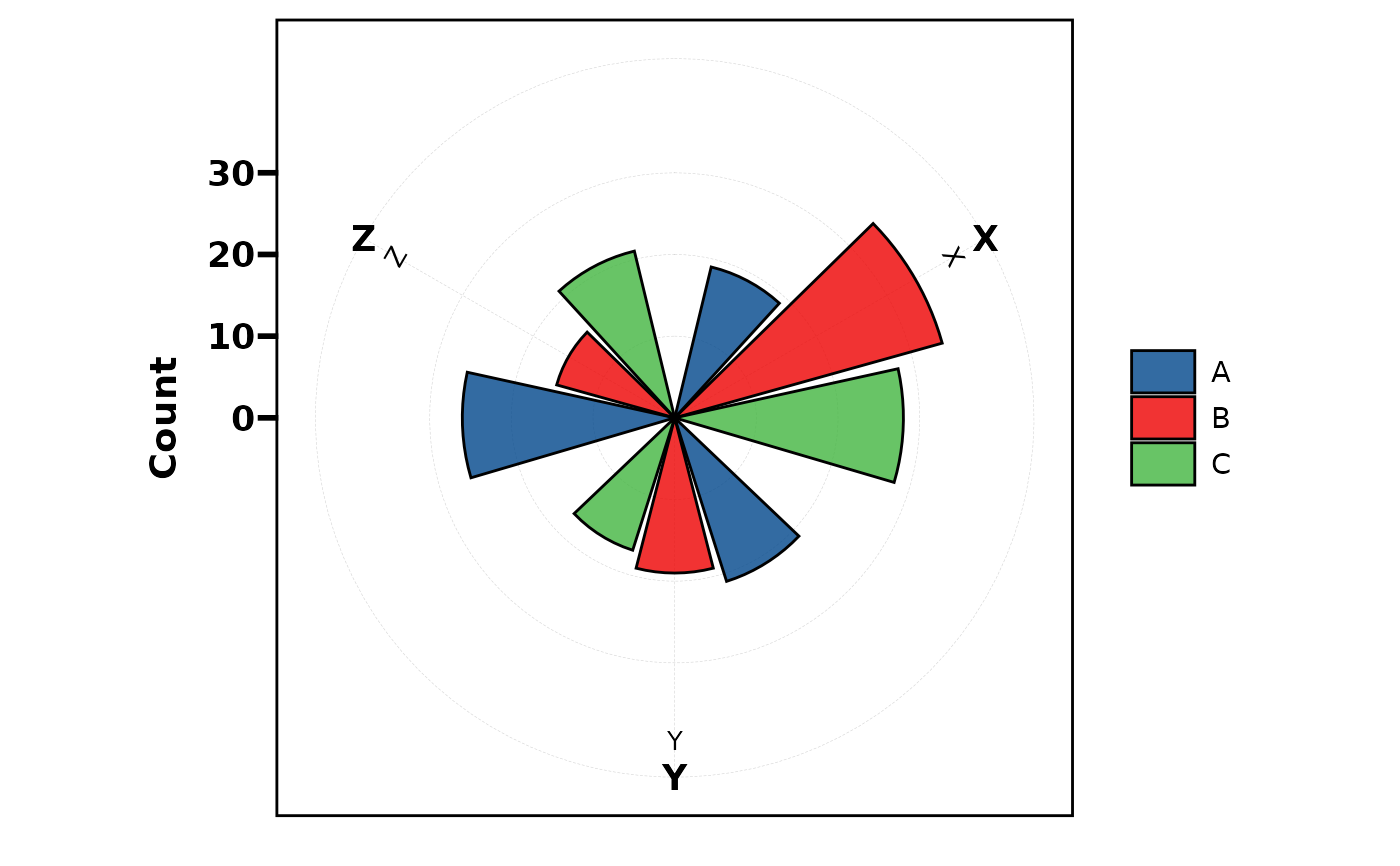
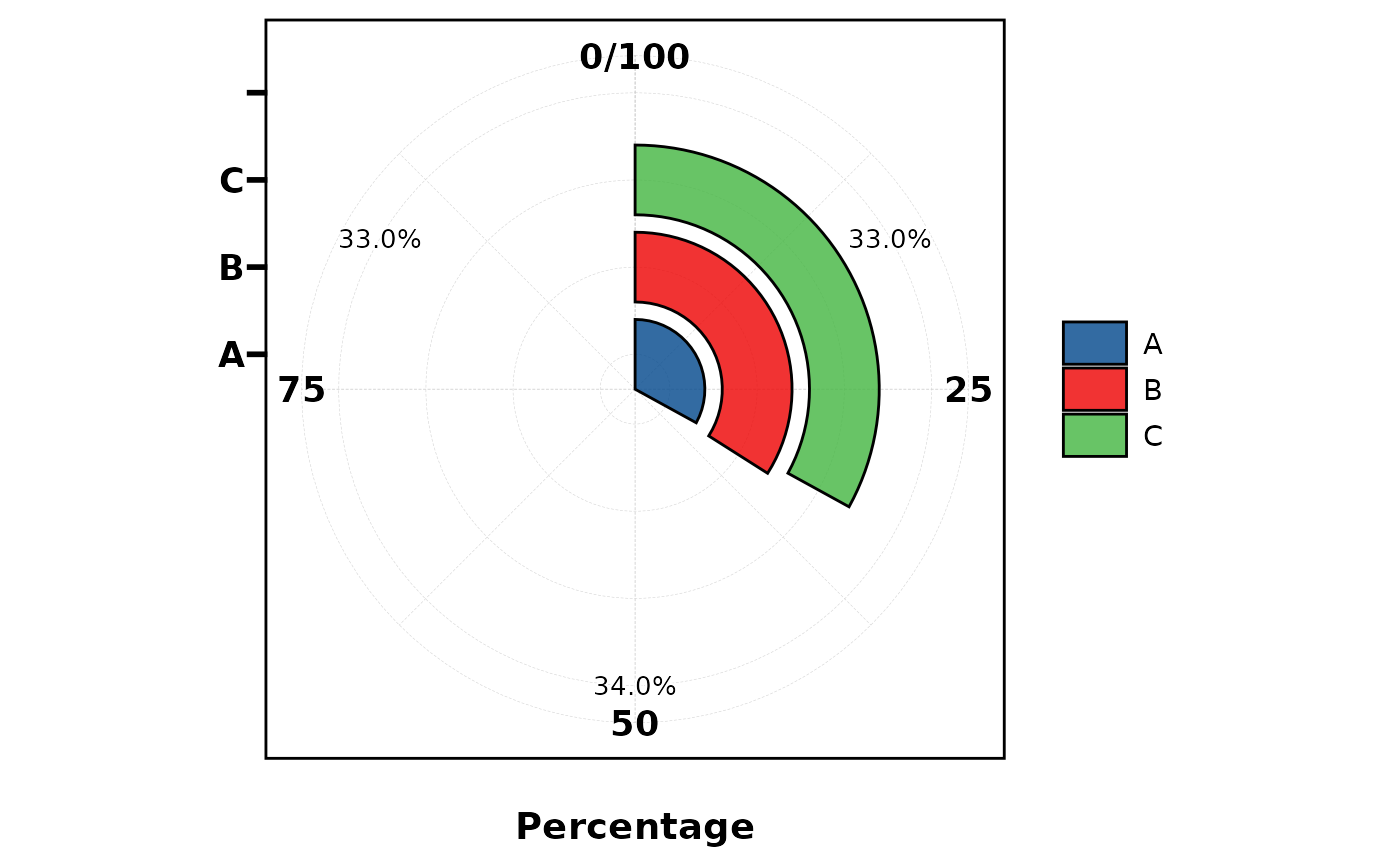
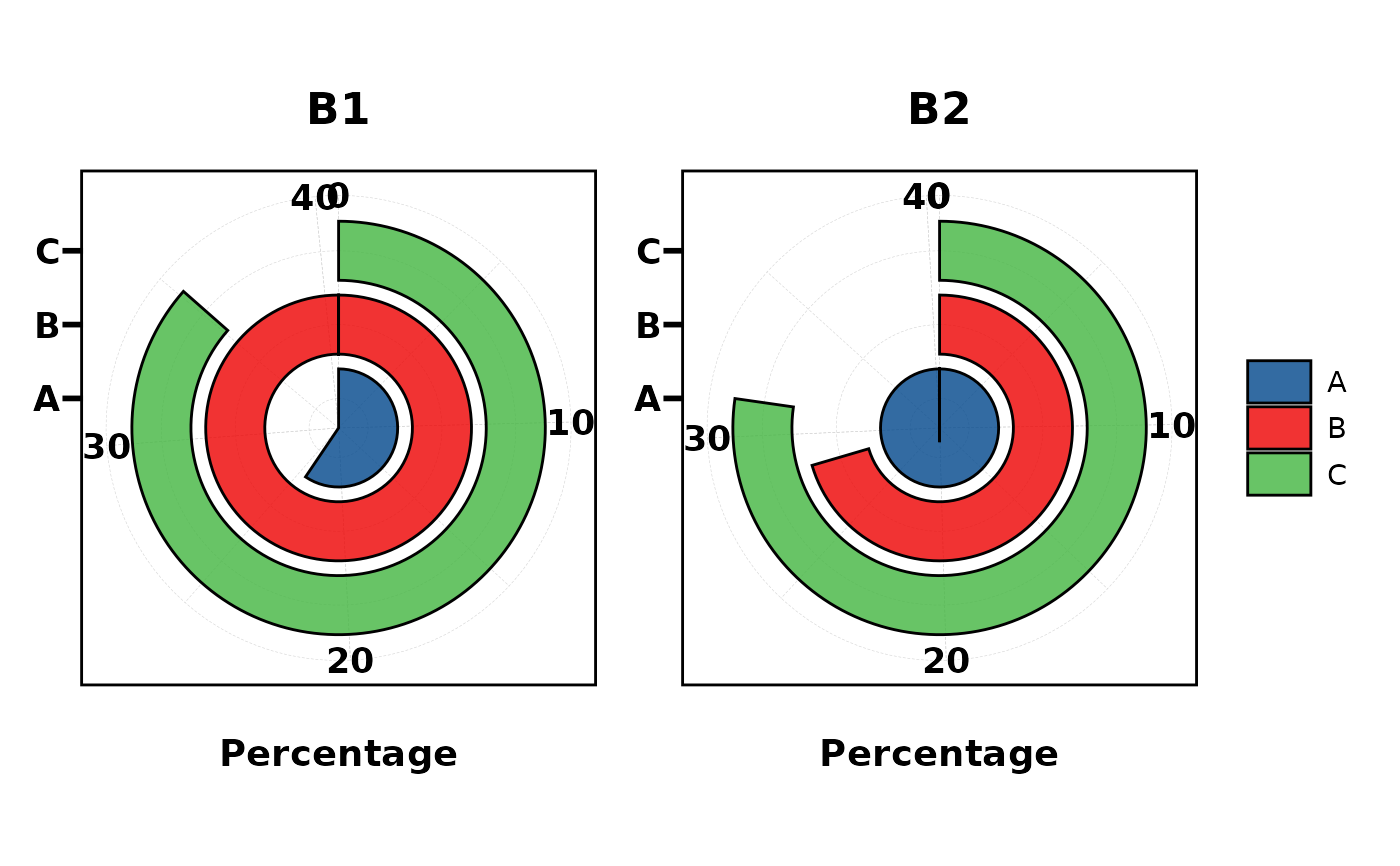
 # ===== 2. Rose =====
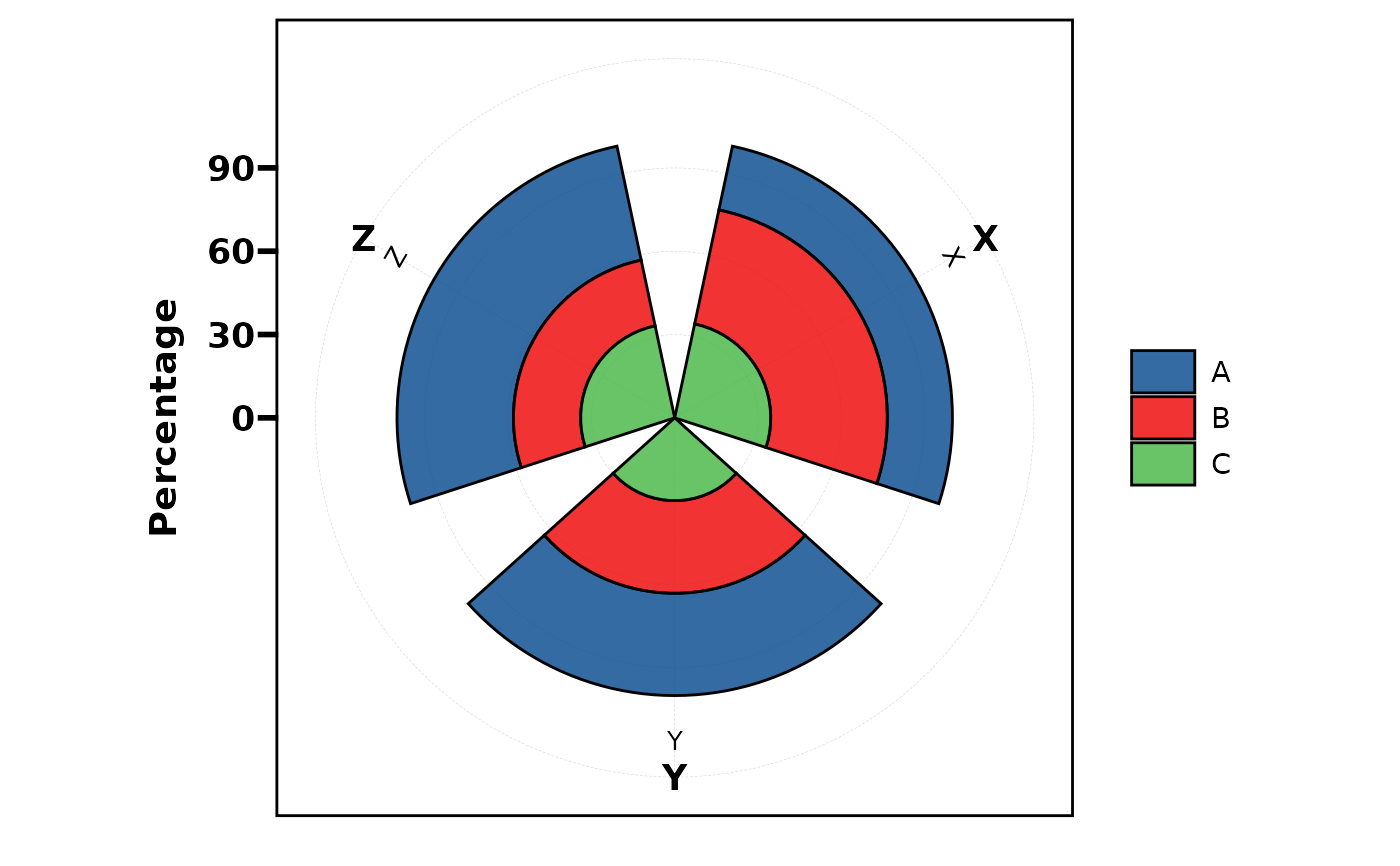
plt_cat(df, "Type", "Group", type = "rose")
# ===== 2. Rose =====
plt_cat(df, "Type", "Group", type = "rose")
 plt_cat(df, "Type", "Group", type = "rose", stat = "count",
position = "dodge")
plt_cat(df, "Type", "Group", type = "rose", stat = "count",
position = "dodge")
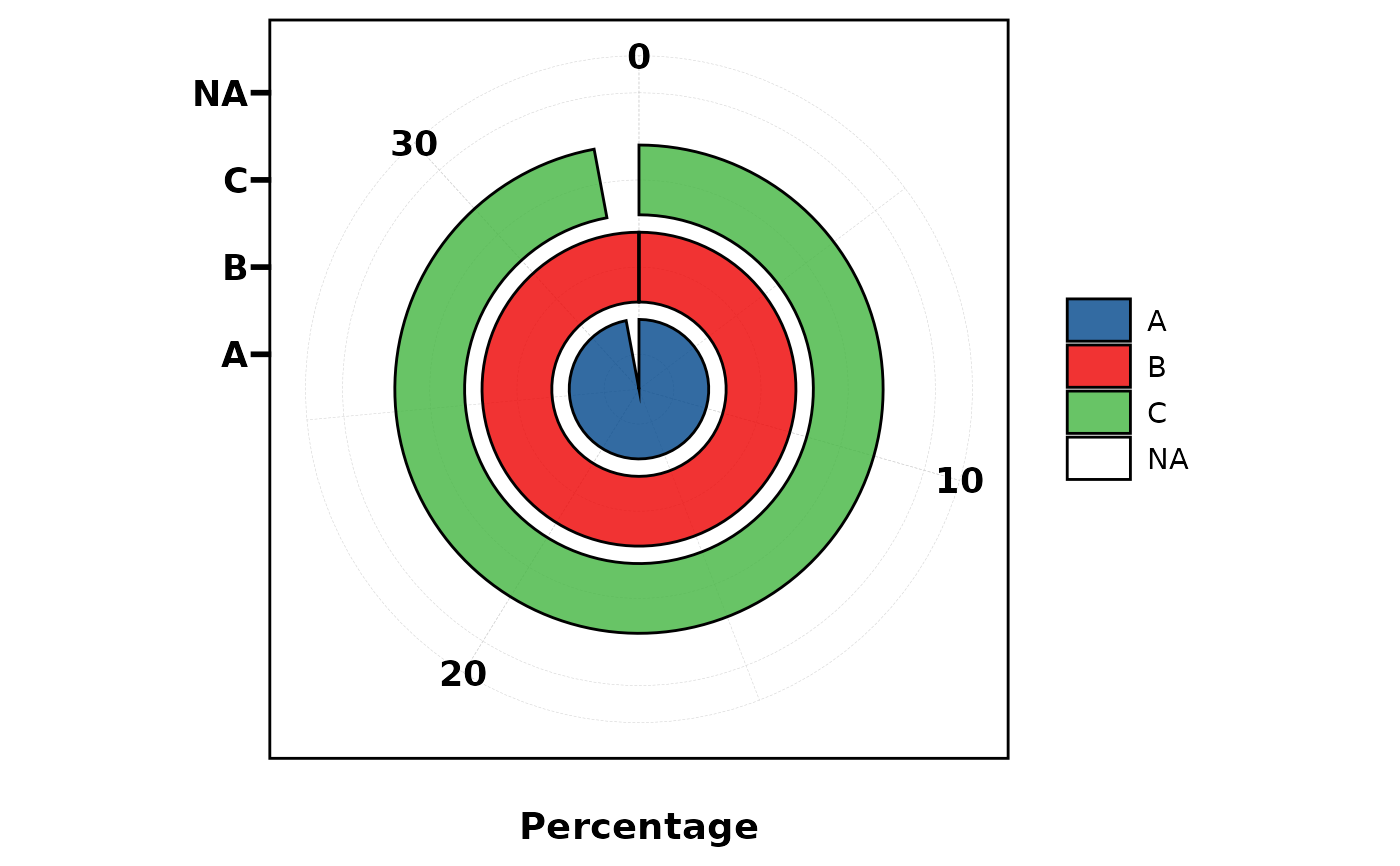
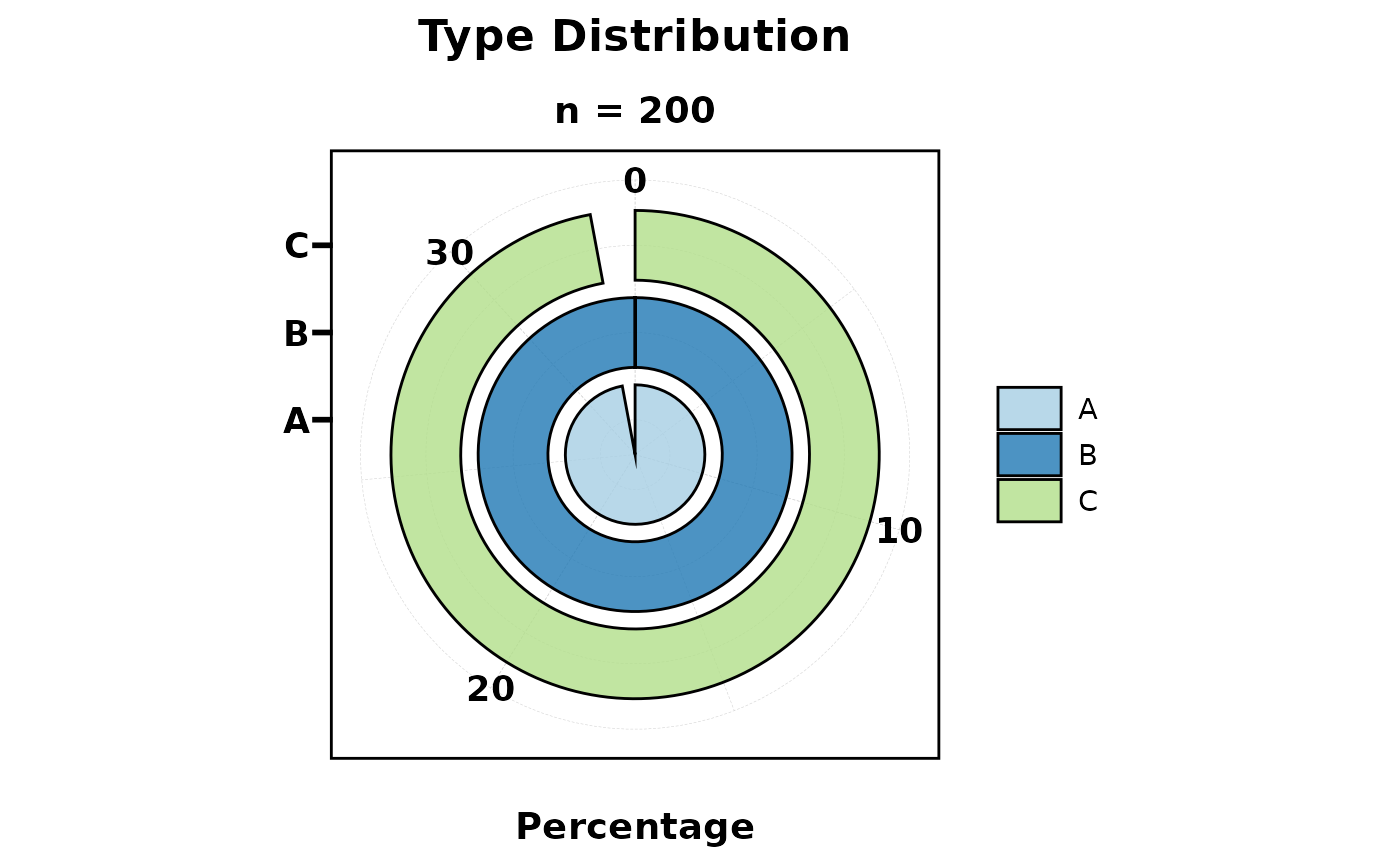
 # ===== 3. Ring (donut) =====
plt_cat(df, "Type", type = "ring")
#> Warning: Removed 1 row containing missing values or values outside the scale range
#> (`geom_col()`).
# ===== 3. Ring (donut) =====
plt_cat(df, "Type", type = "ring")
#> Warning: Removed 1 row containing missing values or values outside the scale range
#> (`geom_col()`).
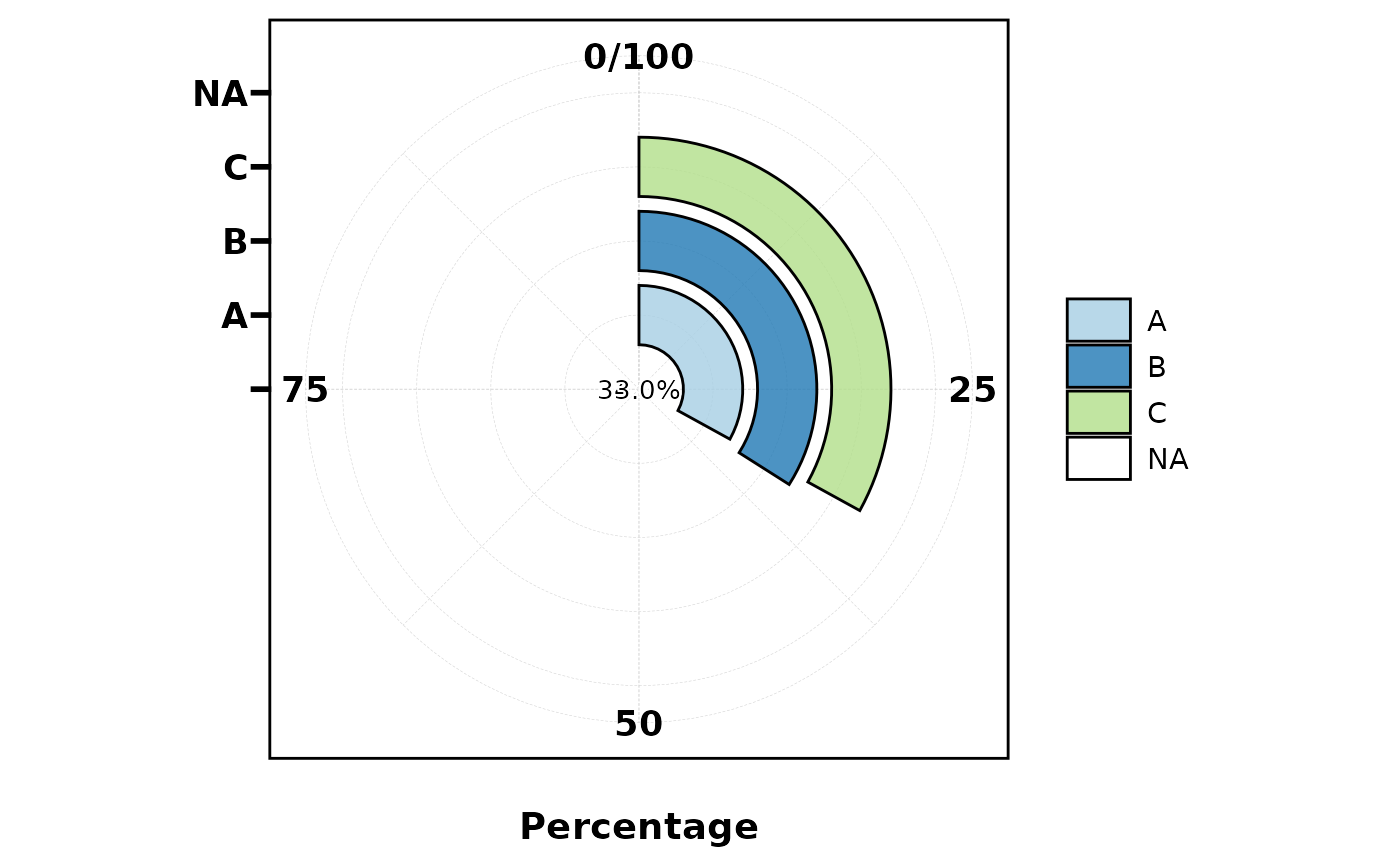
 plt_cat(df, "Type", type = "ring", label = TRUE,
palette = "Paired")
#> Warning: Removed 1 row containing missing values or values outside the scale range
#> (`geom_col()`).
plt_cat(df, "Type", type = "ring", label = TRUE,
palette = "Paired")
#> Warning: Removed 1 row containing missing values or values outside the scale range
#> (`geom_col()`).
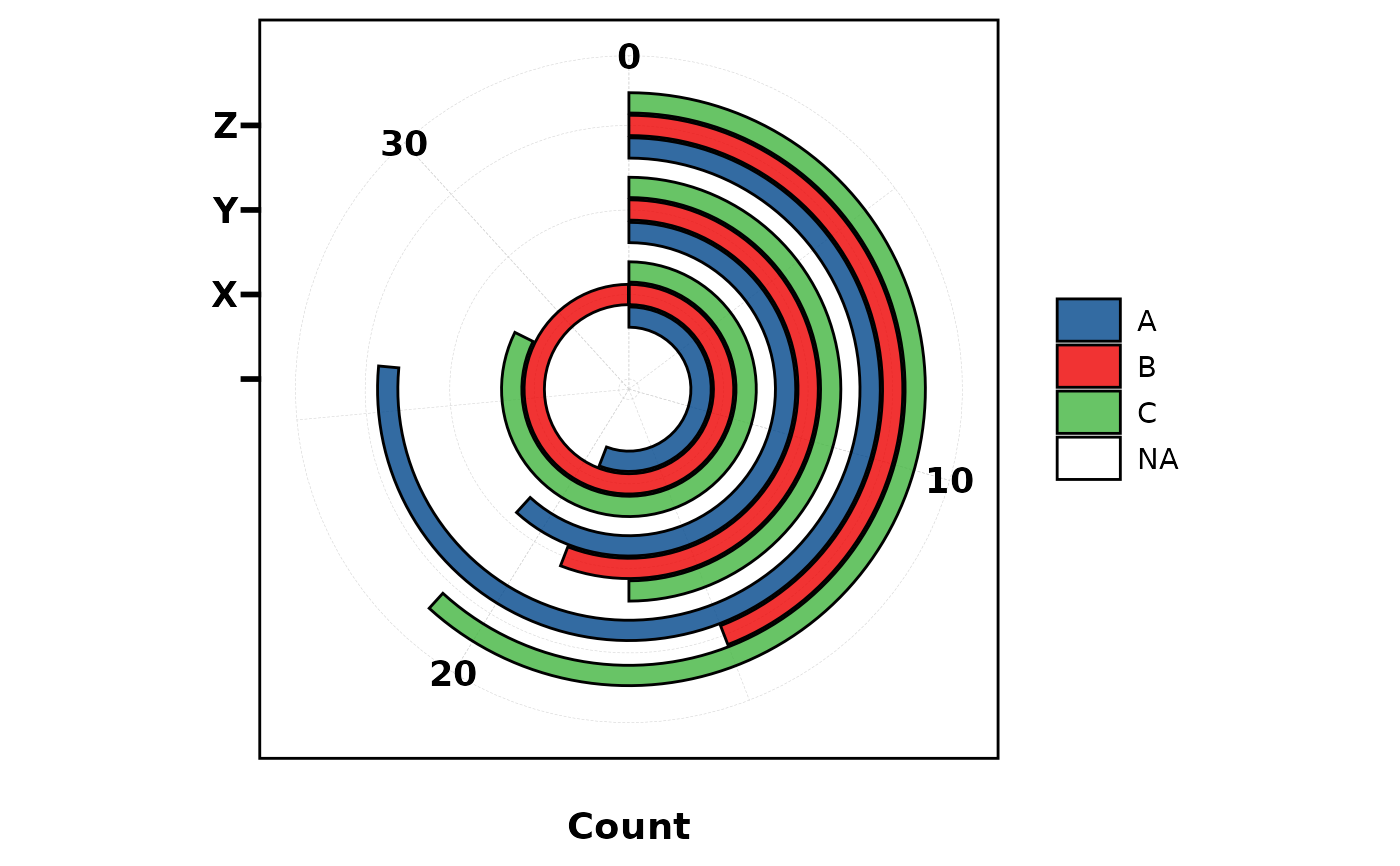
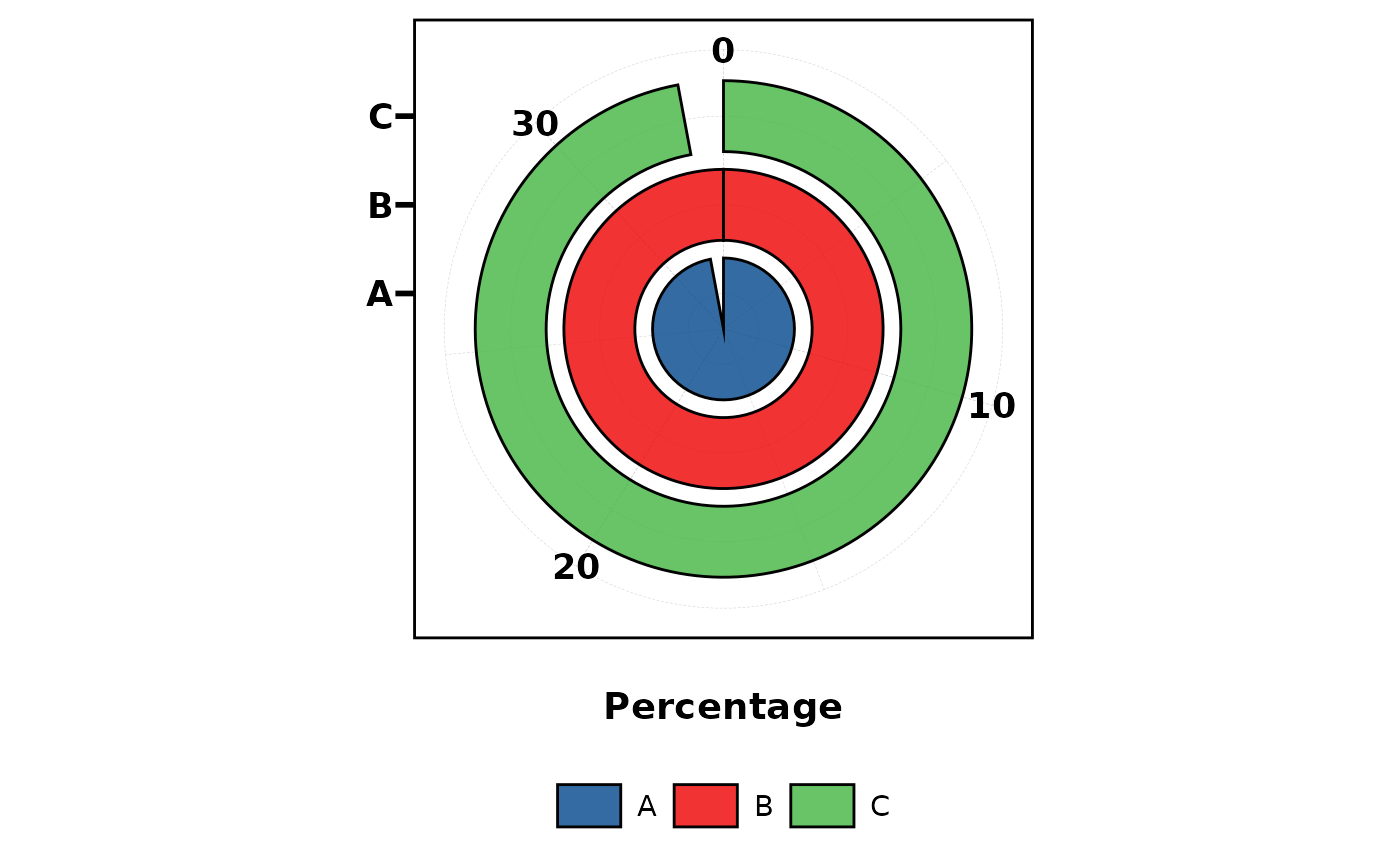
 plt_cat(df, "Type", "Group", type = "ring", stat = "count",
position = "dodge")
#> Warning: Removed 1 row containing missing values or values outside the scale range
#> (`geom_col()`).
plt_cat(df, "Type", "Group", type = "ring", stat = "count",
position = "dodge")
#> Warning: Removed 1 row containing missing values or values outside the scale range
#> (`geom_col()`).
 # ===== 4. Pie =====
plt_cat(df, "Type", type = "pie", label = TRUE)
# ===== 4. Pie =====
plt_cat(df, "Type", type = "pie", label = TRUE)
 plt_cat(df, "Type", type = "pie", palette = "Paired",
title = "Type Distribution", subtitle = "n = 200")
plt_cat(df, "Type", type = "pie", palette = "Paired",
title = "Type Distribution", subtitle = "n = 200")
 plt_cat(df, "Type", type = "pie", legend.position = "bottom",
legend.direction = "horizontal")
plt_cat(df, "Type", type = "pie", legend.position = "bottom",
legend.direction = "horizontal")
 # ===== 5. Trend =====
plt_cat(df, "Type", "Group", type = "trend", stat = "count")
# ===== 5. Trend =====
plt_cat(df, "Type", "Group", type = "trend", stat = "count")
 plt_cat(df, "Type", "Group", type = "trend", stat = "count",
label = TRUE)
plt_cat(df, "Type", "Group", type = "trend", stat = "count",
label = TRUE)
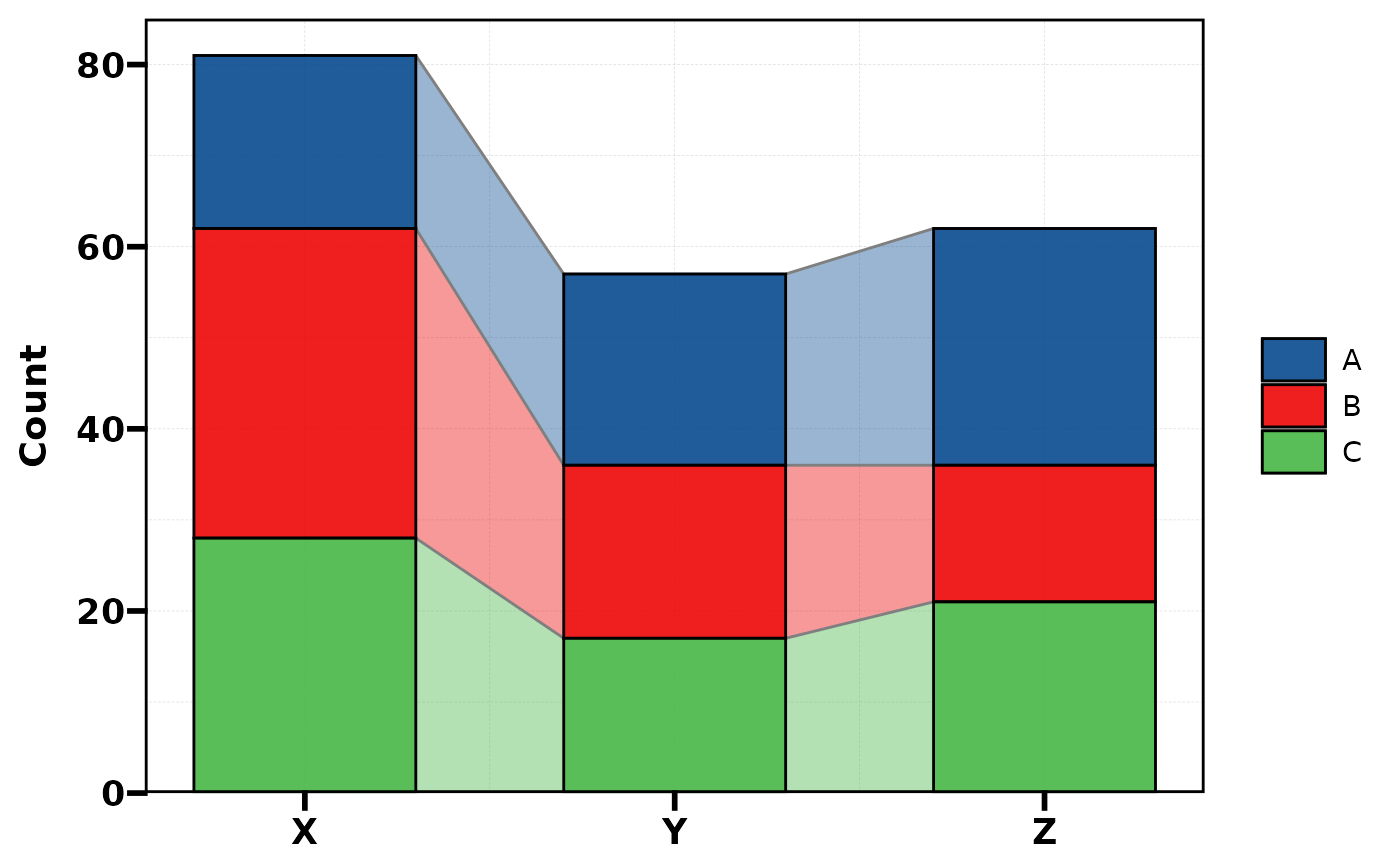
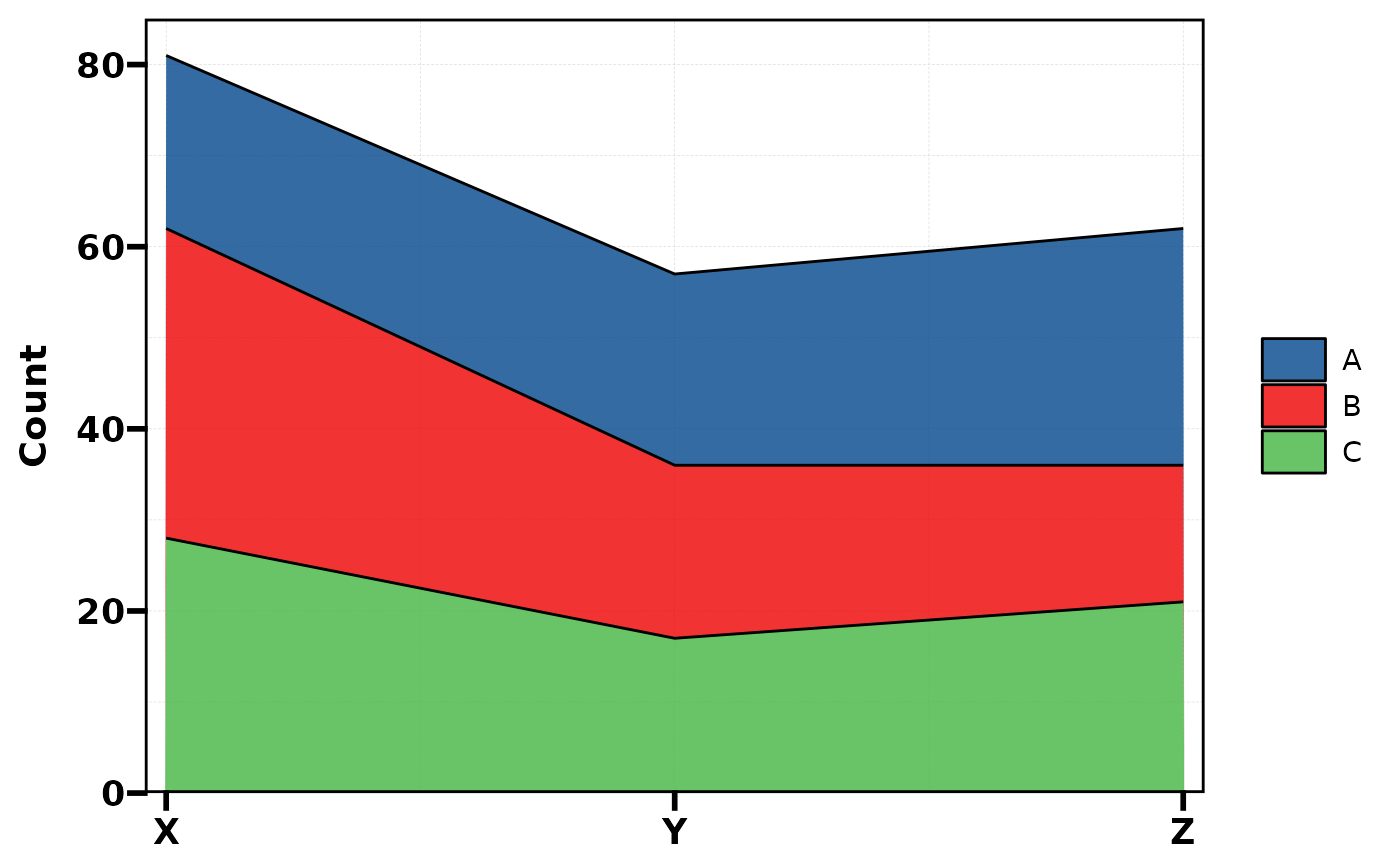
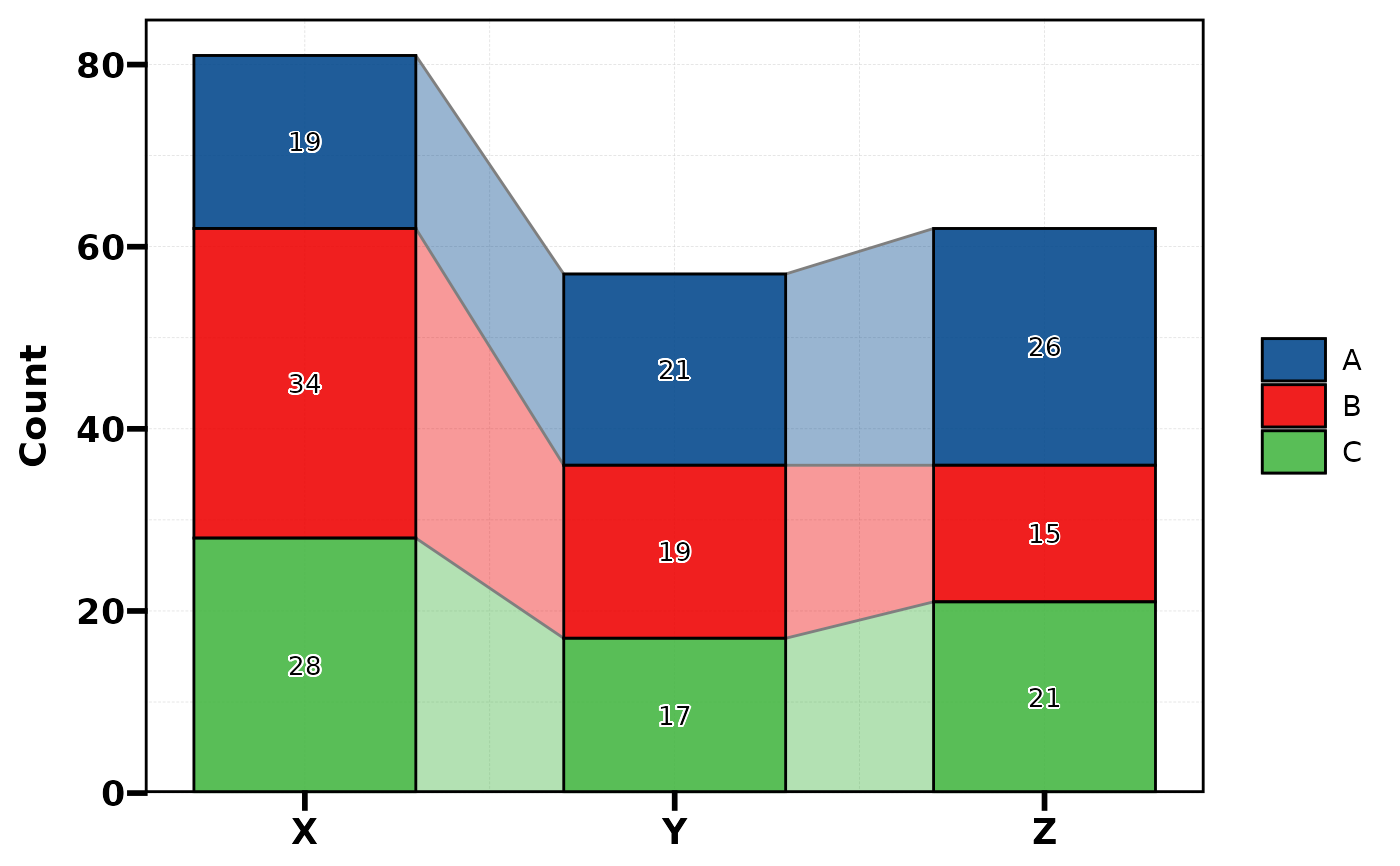 # ===== 6. Area =====
plt_cat(df, "Type", "Group", type = "area", stat = "count")
# ===== 6. Area =====
plt_cat(df, "Type", "Group", type = "area", stat = "count")
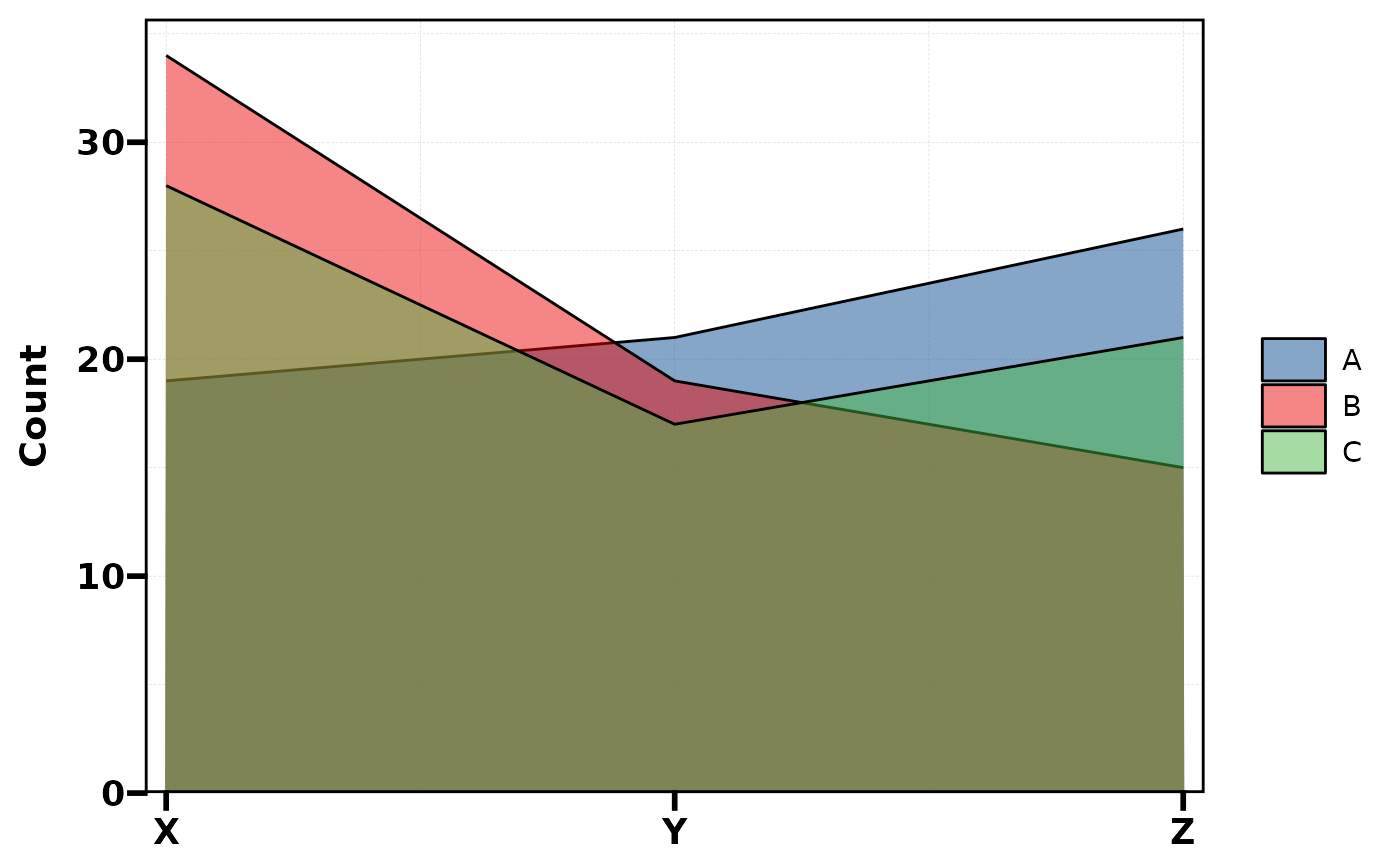
 plt_cat(df, "Type", "Group", type = "area", stat = "count",
position = "dodge")
plt_cat(df, "Type", "Group", type = "area", stat = "count",
position = "dodge")
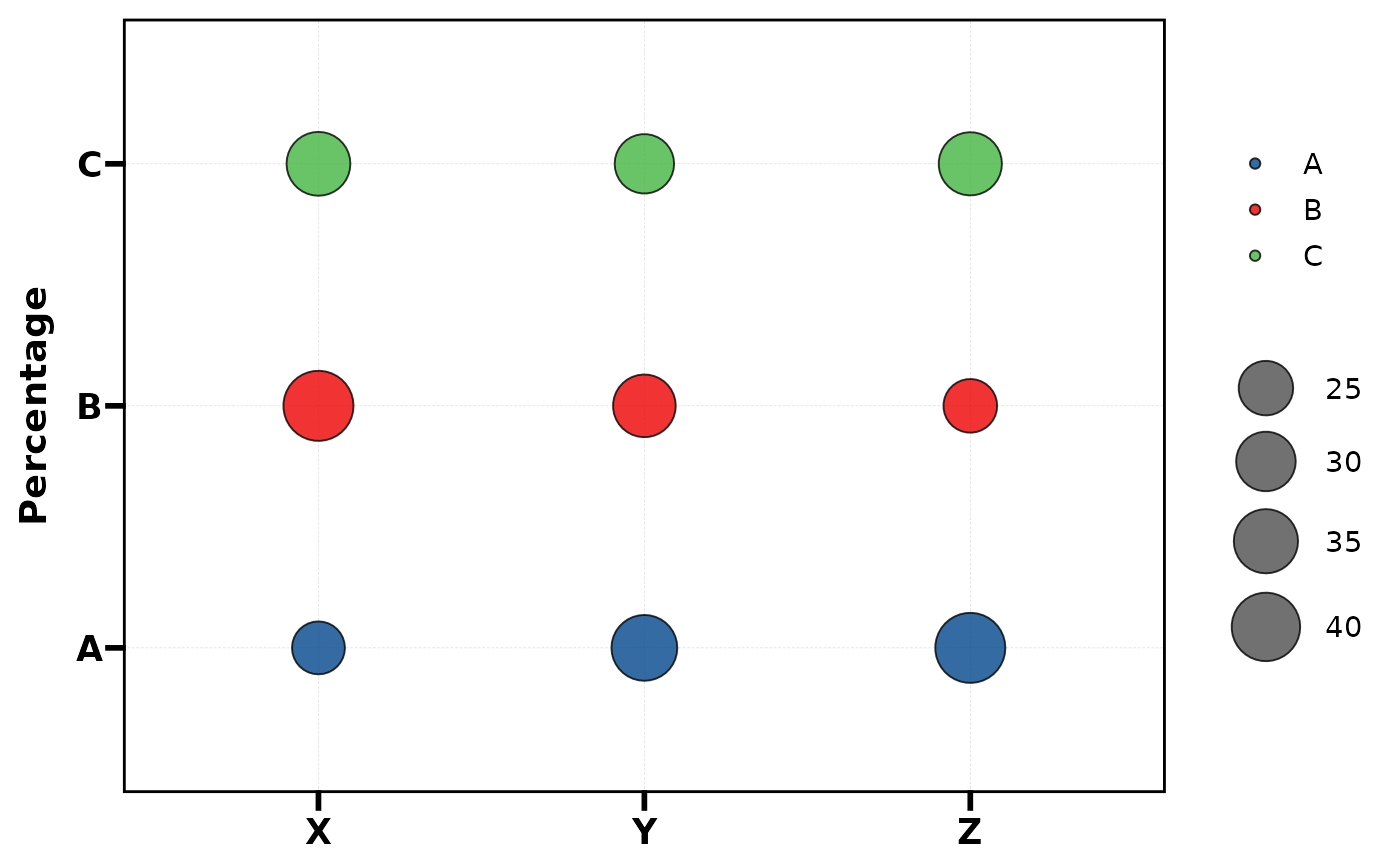
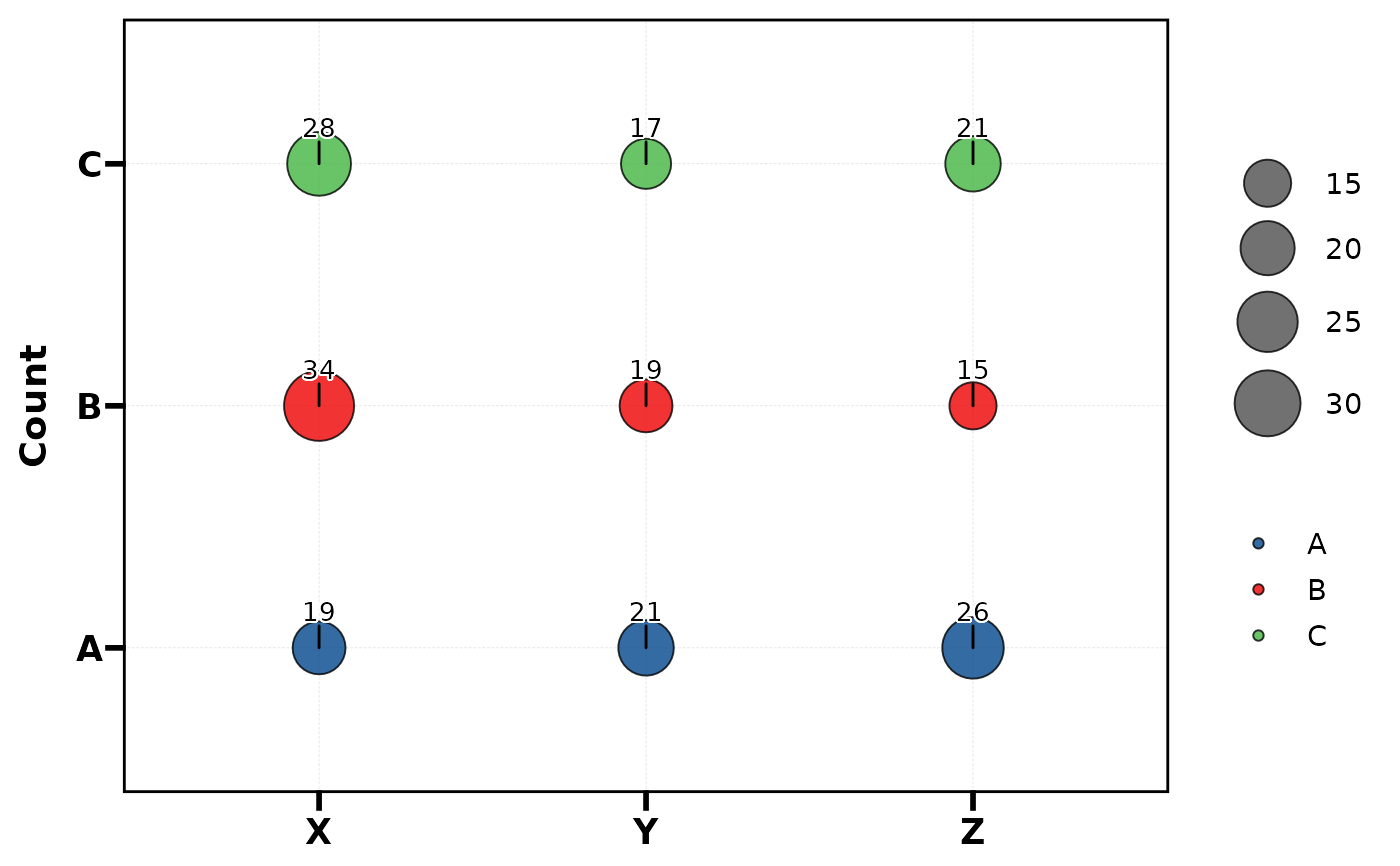
 # ===== 7. Dot =====
plt_cat(df, "Type", "Group", type = "dot")
# ===== 7. Dot =====
plt_cat(df, "Type", "Group", type = "dot")
 plt_cat(df, "Type", "Group", type = "dot", label = TRUE,
stat = "count")
plt_cat(df, "Type", "Group", type = "dot", label = TRUE,
stat = "count")
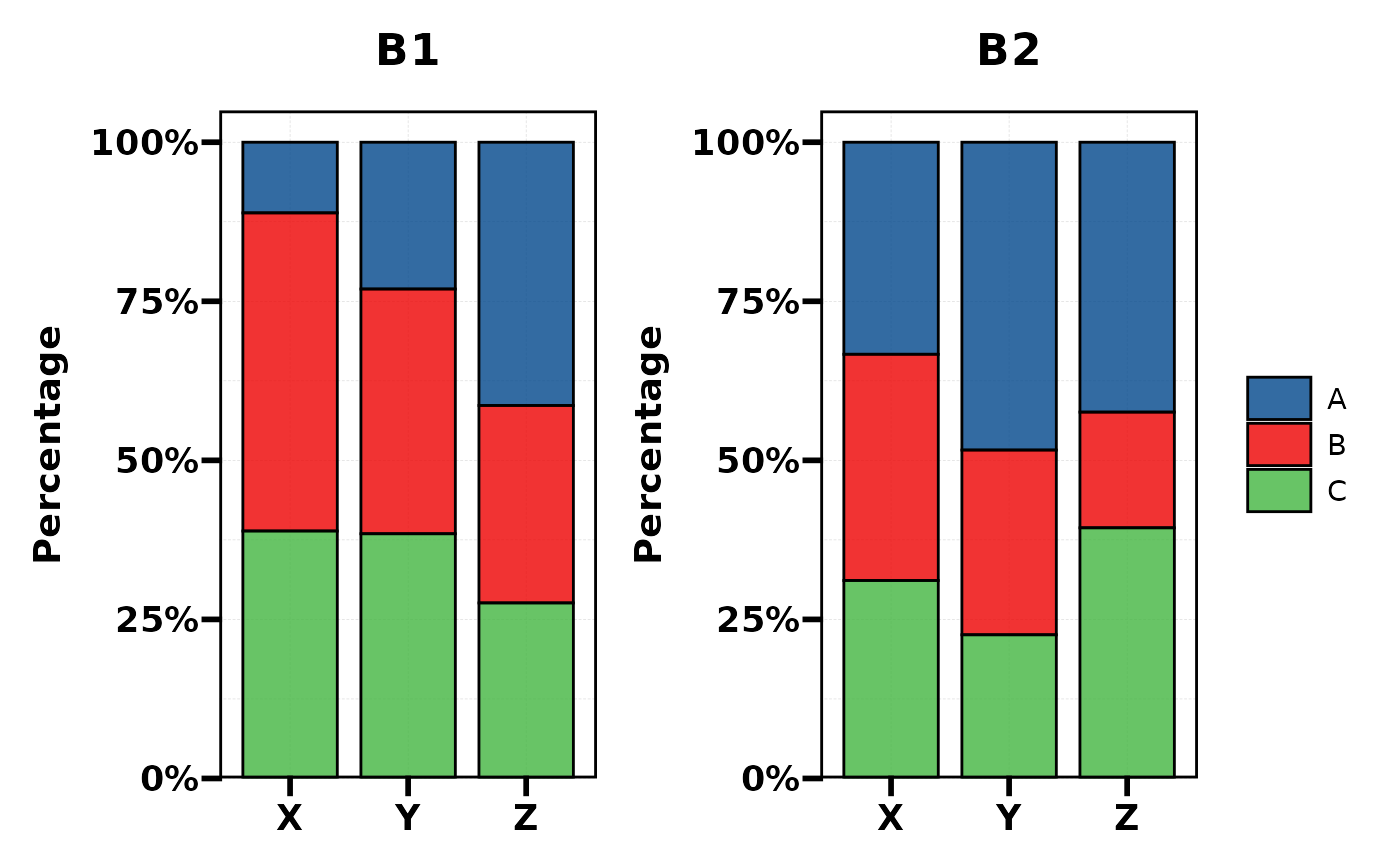
 # ===== split.by / NA / keep_empty / aspect =====
plt_cat(df, "Type", "Group", split.by = "Batch", type = "bar")
# ===== split.by / NA / keep_empty / aspect =====
plt_cat(df, "Type", "Group", split.by = "Batch", type = "bar")
 plt_cat(df, "Type", split.by = "Batch", type = "pie",
facet_ncol = 2)
plt_cat(df, "Type", split.by = "Batch", type = "pie",
facet_ncol = 2)
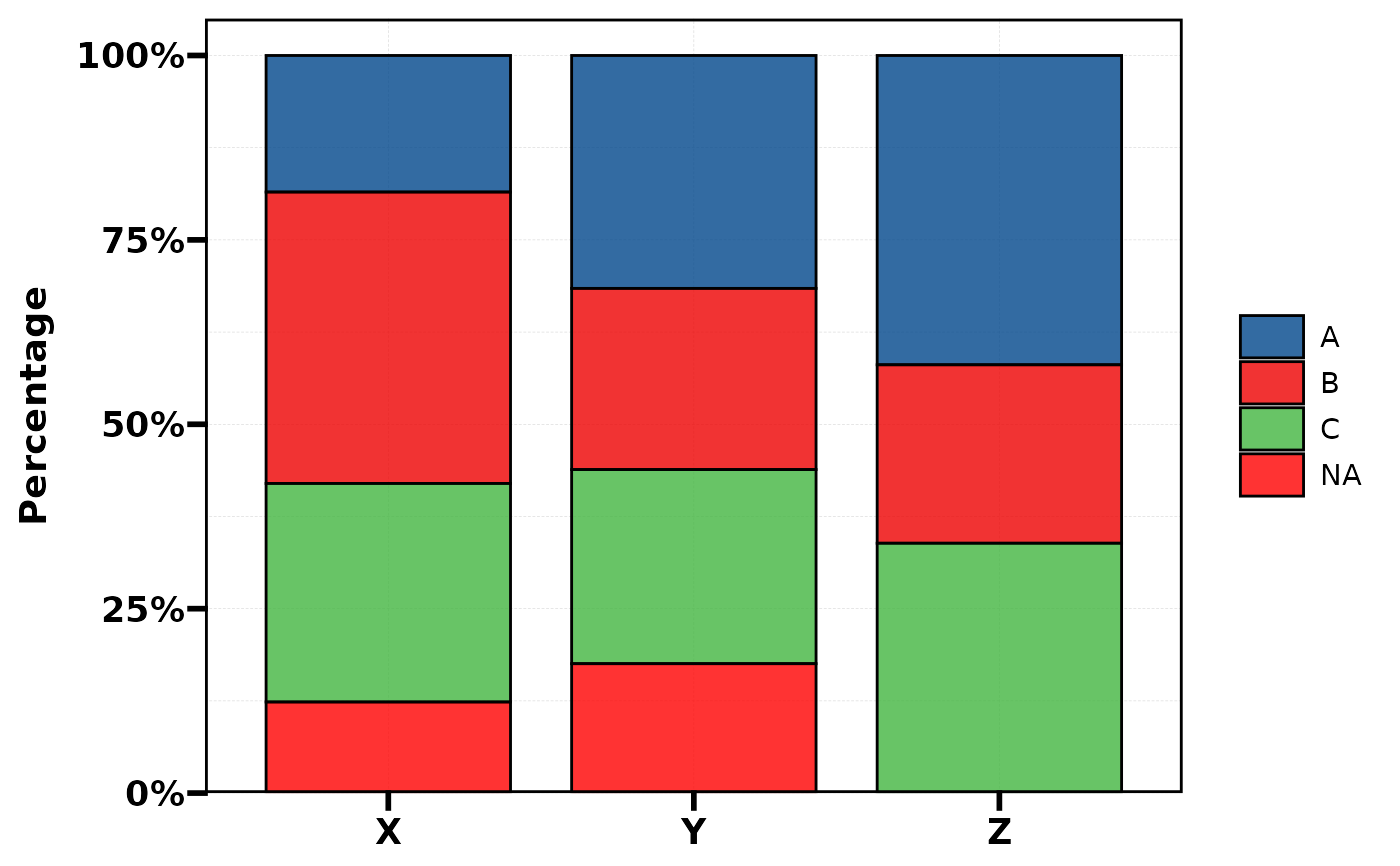
 # NA handling
df_na <- df; df_na$Type[1:20] <- NA
plt_cat(df_na, "Type", "Group", type = "bar",
NA_stat = TRUE, NA_color = "red")
# NA handling
df_na <- df; df_na$Type[1:20] <- NA
plt_cat(df_na, "Type", "Group", type = "bar",
NA_stat = TRUE, NA_color = "red")
 # keep_empty: preserve dropped levels
df2 <- df[df$Type != "C", ]
plt_cat(df2, "Type", "Group", type = "bar", keep_empty = TRUE)
# keep_empty: preserve dropped levels
df2 <- df[df$Type != "C", ]
plt_cat(df2, "Type", "Group", type = "bar", keep_empty = TRUE)
 # aspect.ratio
plt_cat(df, "Type", "Group", type = "bar", aspect.ratio = 0.5)
# aspect.ratio
plt_cat(df, "Type", "Group", type = "bar", aspect.ratio = 0.5)
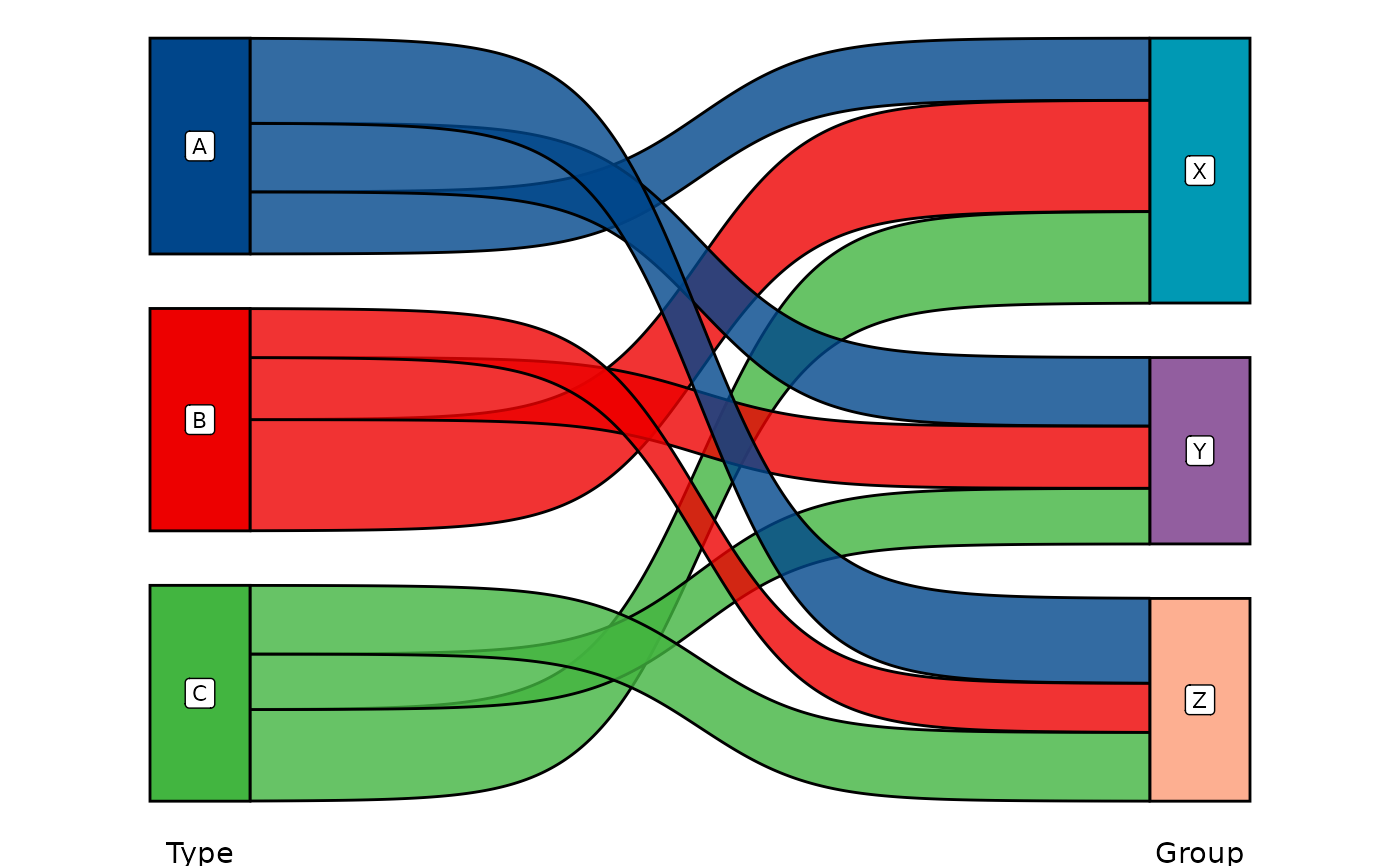
 # ===== 8. Sankey =====
plt_cat(df, c("Type", "Group"), type = "sankey")
#> Warning: attributes are not identical across measure variables; they will be dropped
# ===== 8. Sankey =====
plt_cat(df, c("Type", "Group"), type = "sankey")
#> Warning: attributes are not identical across measure variables; they will be dropped
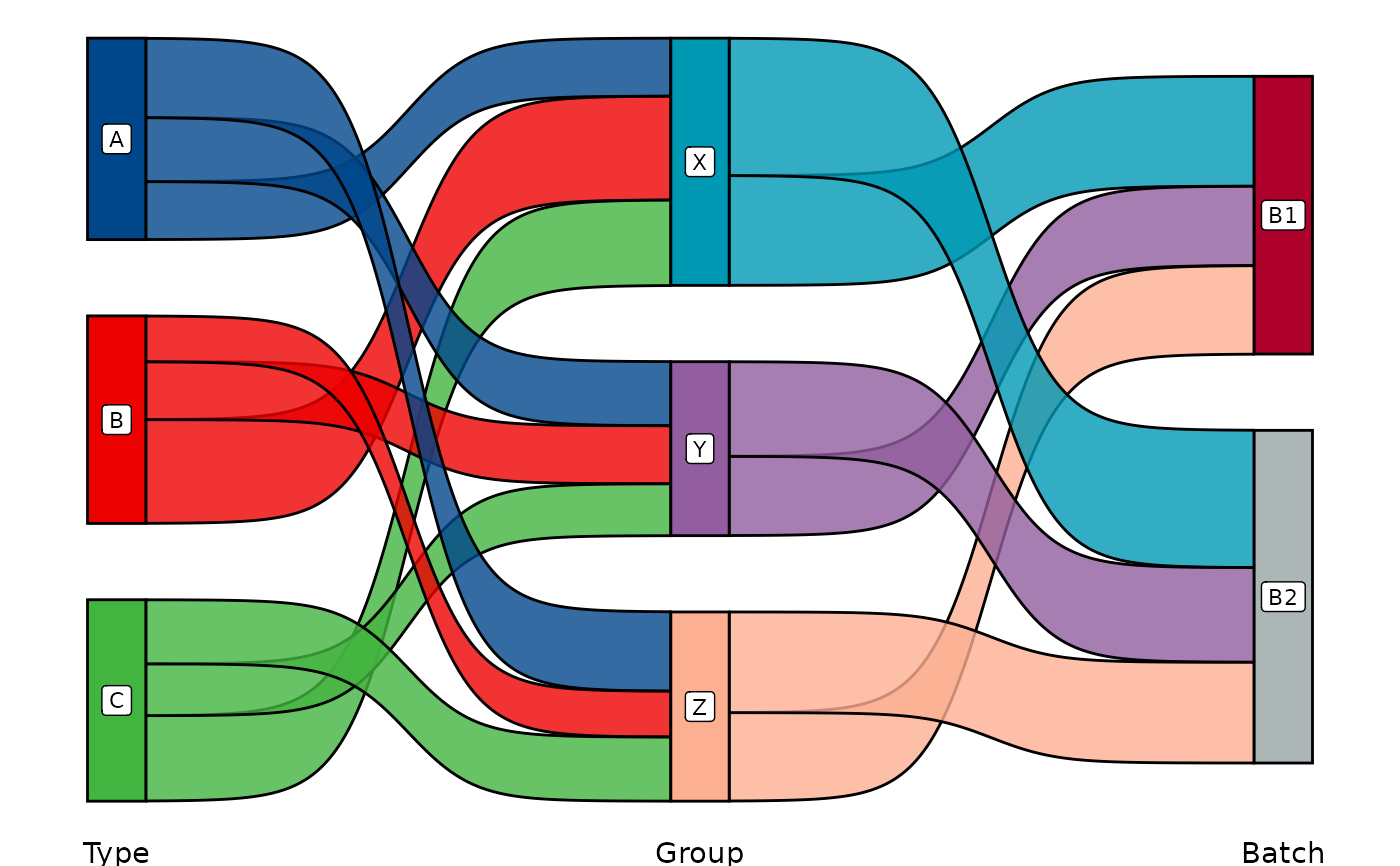
 plt_cat(df, c("Type", "Group", "Batch"), type = "sankey")
#> Warning: attributes are not identical across measure variables; they will be dropped
plt_cat(df, c("Type", "Group", "Batch"), type = "sankey")
#> Warning: attributes are not identical across measure variables; they will be dropped
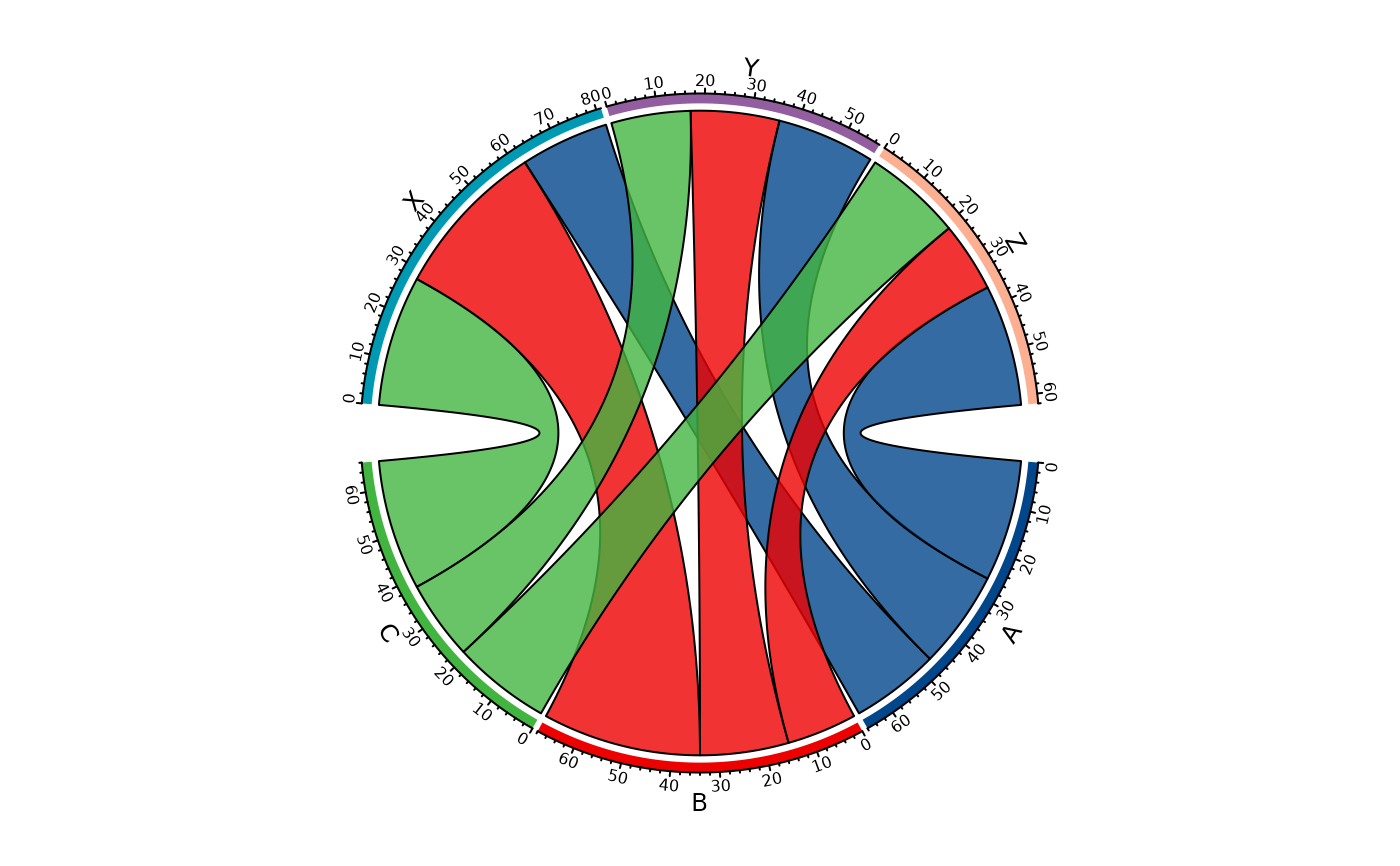
 # ===== 9. Chord =====
plt_cat(df, c("Type", "Group"), type = "chord")
# ===== 9. Chord =====
plt_cat(df, c("Type", "Group"), type = "chord")
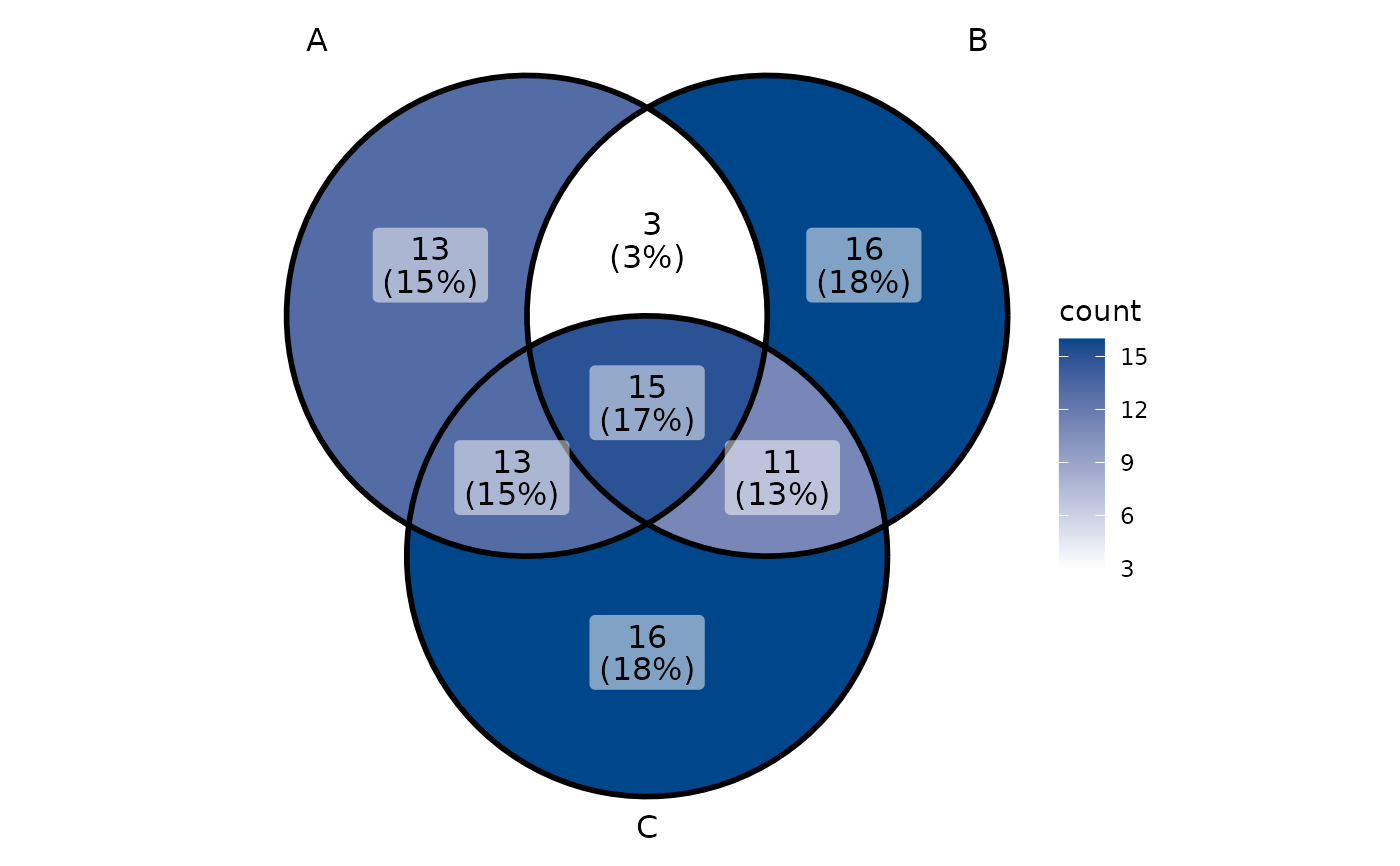
 # ===== 10. Venn =====
set.seed(42)
df_bin <- data.frame(
A = sample(c("Yes","No"), 100, TRUE),
B = sample(c("Yes","No"), 100, TRUE),
C = sample(c("Yes","No"), 100, TRUE)
)
plt_cat(df_bin, c("A","B","C"), type = "venn")
# ===== 10. Venn =====
set.seed(42)
df_bin <- data.frame(
A = sample(c("Yes","No"), 100, TRUE),
B = sample(c("Yes","No"), 100, TRUE),
C = sample(c("Yes","No"), 100, TRUE)
)
plt_cat(df_bin, c("A","B","C"), type = "venn")
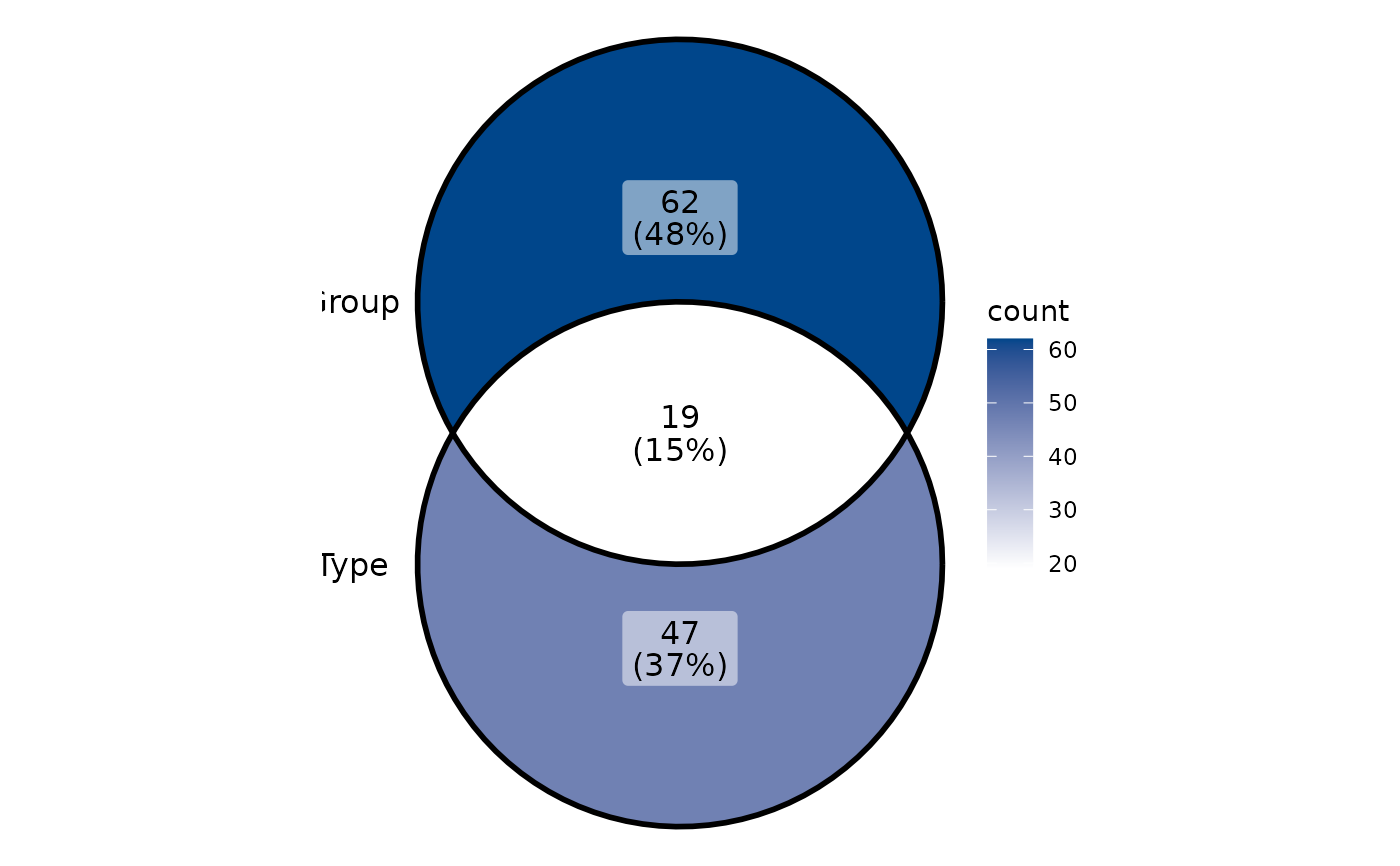
 plt_cat(df, c("Type","Group"), type = "venn", stat_level = c("A","X"))
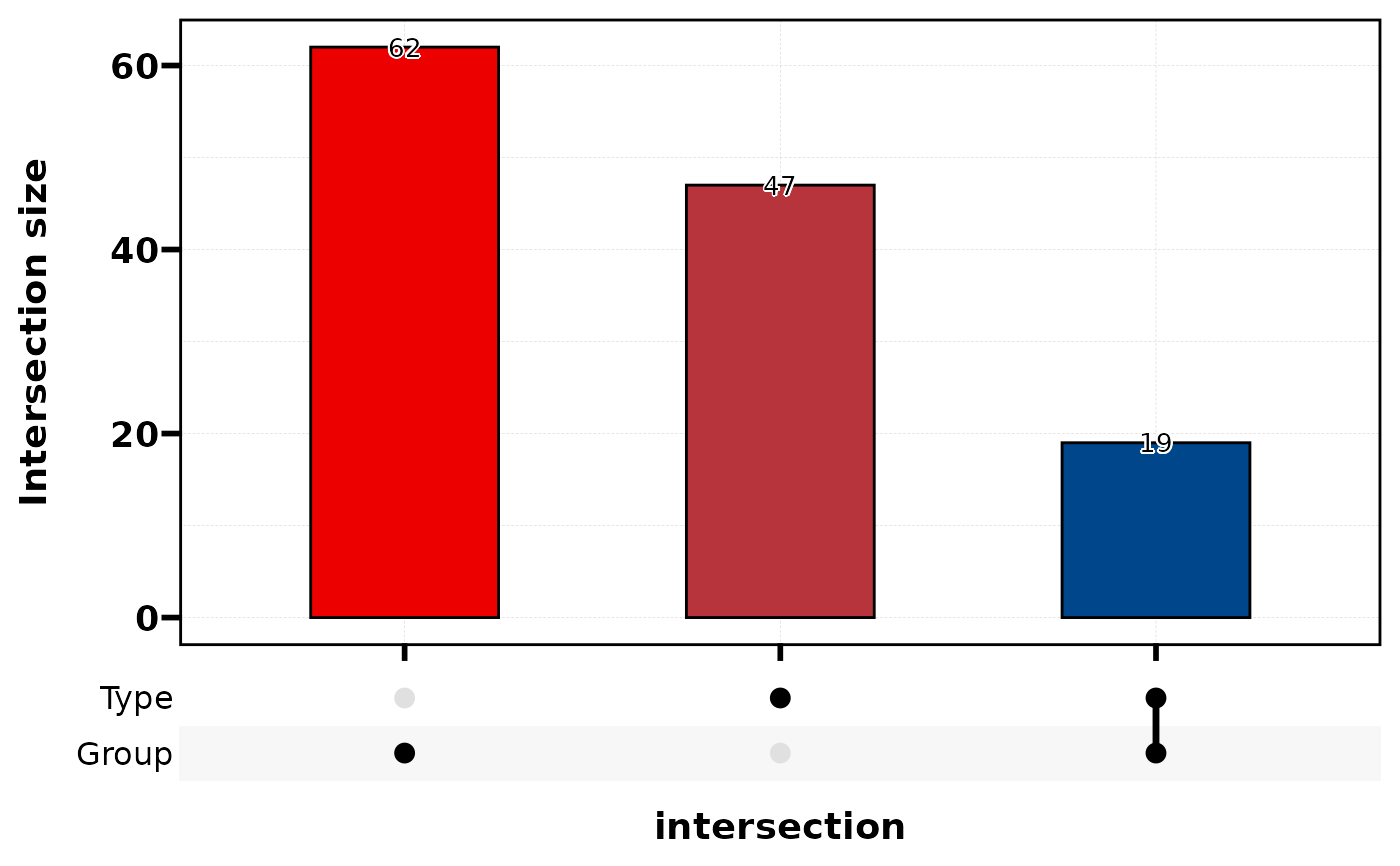
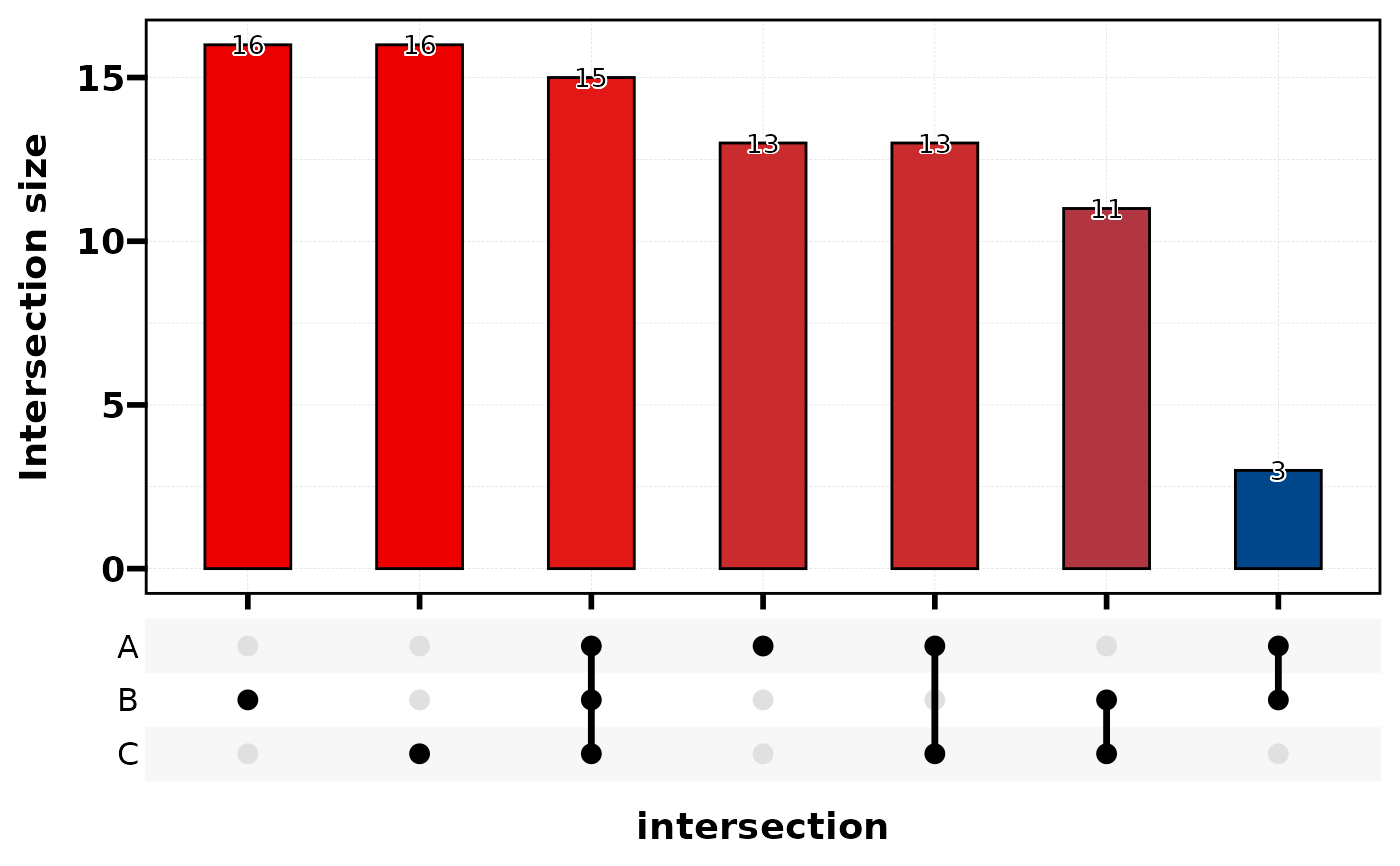
 # ===== 11. UpSet =====
plt_cat(df_bin, c("A","B","C"), type = "upset")
#> Warning: Using `size` aesthetic for lines was deprecated in ggplot2 3.4.0.
#> ℹ Please use `linewidth` instead.
#> ℹ The deprecated feature was likely used in the ggupset package.
#> Please report the issue at <https://github.com/const-ae/ggupset/issues>.
# ===== 11. UpSet =====
plt_cat(df_bin, c("A","B","C"), type = "upset")
#> Warning: Using `size` aesthetic for lines was deprecated in ggplot2 3.4.0.
#> ℹ Please use `linewidth` instead.
#> ℹ The deprecated feature was likely used in the ggupset package.
#> Please report the issue at <https://github.com/const-ae/ggupset/issues>.
 plt_cat(df, c("Type","Group"), type = "upset", stat_level = c("A","X"))