Visualise intersections of binary categorical variables using Venn diagrams and UpSet plots. Returns both plots and a data frame with intersection group assignments.
Arguments
- data
A data frame.
- vars
Character vector of binary variable names to intersect.
- levels
Character vector of values indicating membership (e.g.
c("Yes", "yes", "1")). Defaultc("Yes", "yes").- colors
Character vector of 3 colours for
c(sets_bar, top_bar, matrix_dots). Default usespal_lancet.- output
What to return:
"venn"Venn diagram only (ggplot).
"upset"UpSet plot only (non-zero intersections).
"both"(default) Combined Venn + UpSet side by side.
"data"Data frame with
intersect_groupcolumn added."all"Named list with all plots and data.
Note
Requires ggVennDiagram and optionally aplot (for combined
layout). Install with pak::pak(c("ggVennDiagram", "aplot")).
See also
Other plot:
PlotButterfly(),
PlotButterfly2(),
PlotRankCor(),
plt_cat(),
plt_cohen(),
plt_con(),
plt_dist(),
plt_radar(),
plt_sankey()
Examples
df <- data.frame(
A = sample(c("Yes","No"), 100, TRUE, c(0.3, 0.7)),
B = sample(c("Yes","No"), 100, TRUE, c(0.4, 0.6)),
C = sample(c("Yes","No"), 100, TRUE, c(0.5, 0.5)),
D = sample(c("Yes","No"), 100, TRUE, c(0.2, 0.8))
)
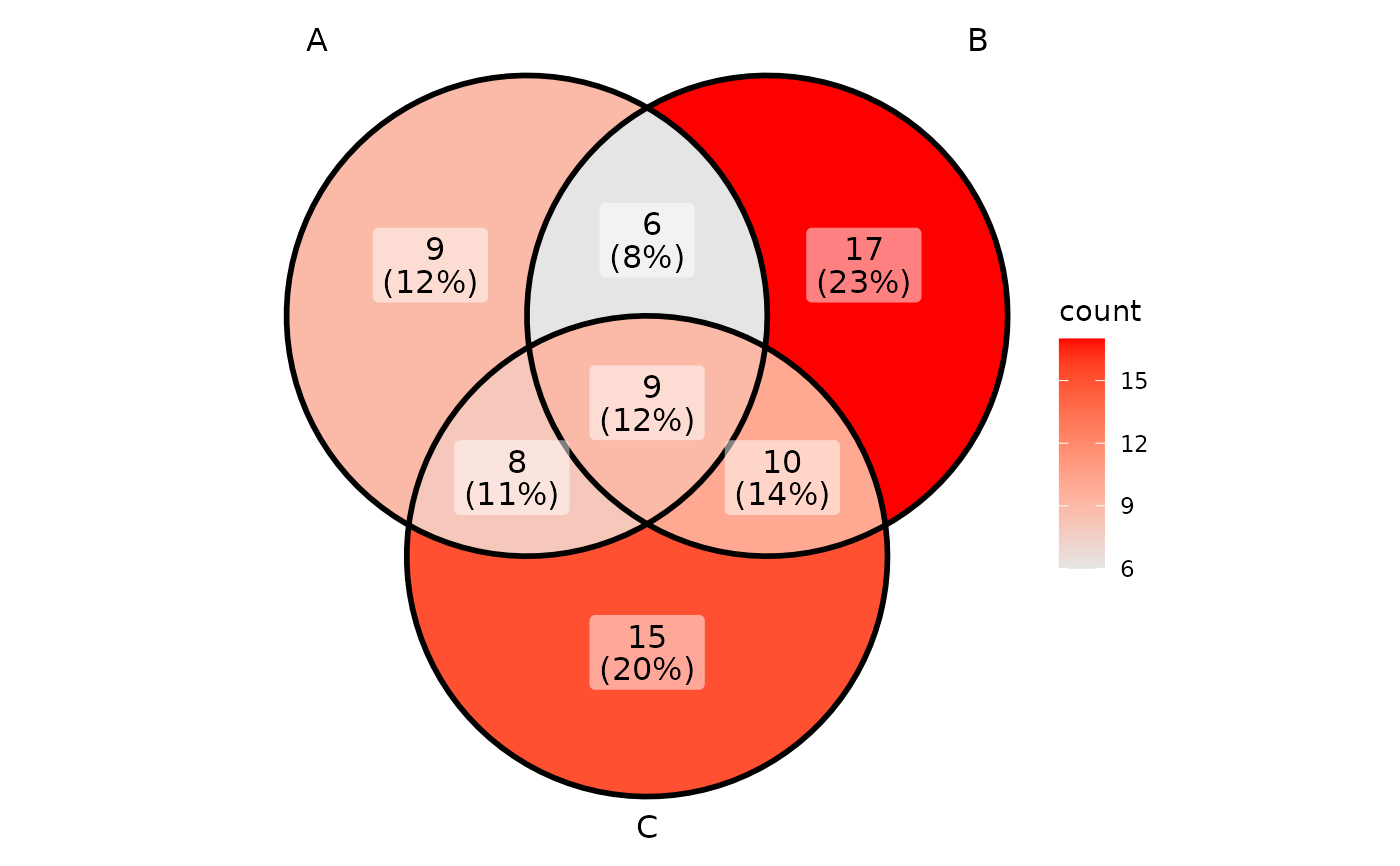
# Venn diagram
plt_upset(df, vars = c("A","B","C"), output = "venn")
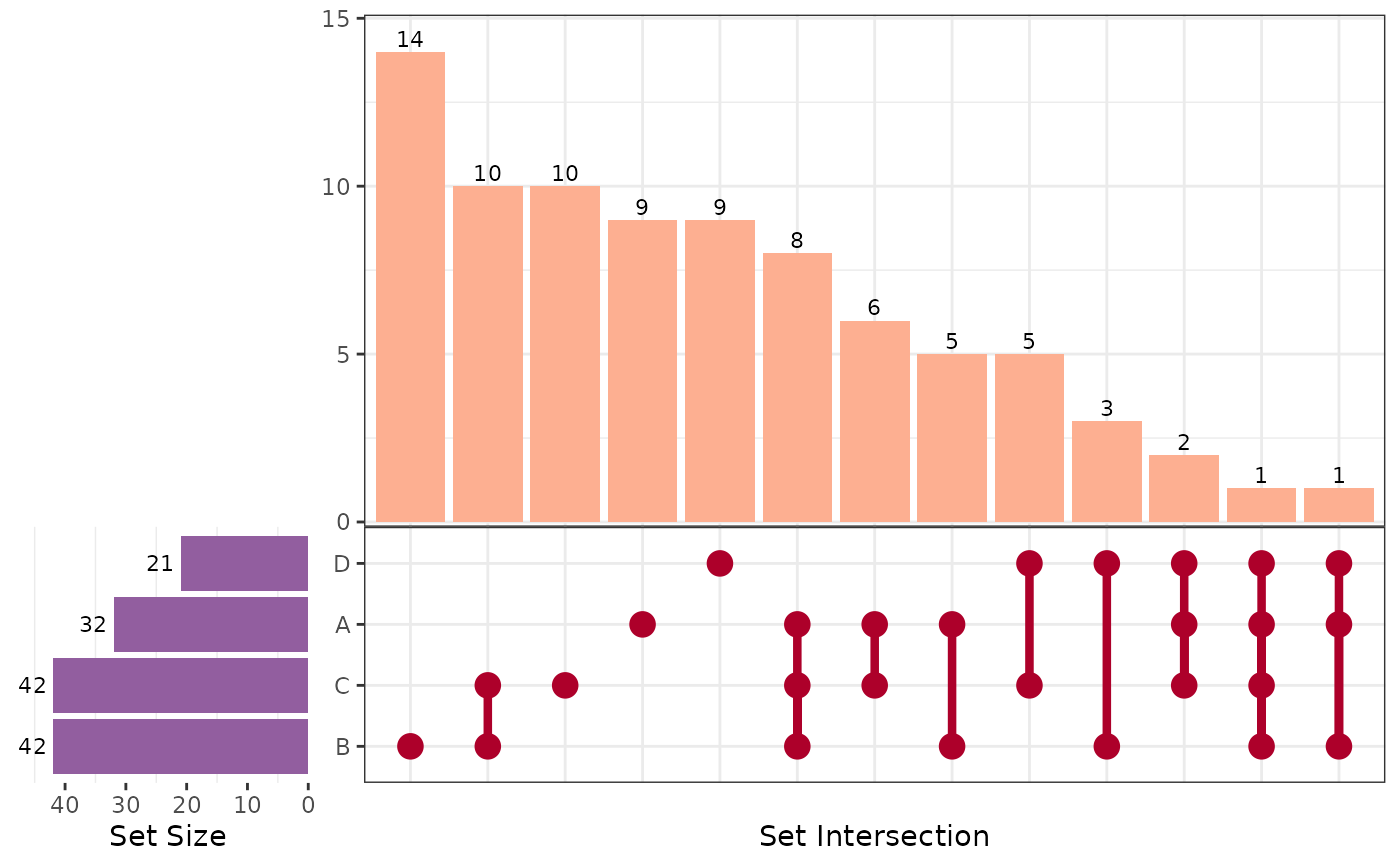
 # UpSet plot
plt_upset(df, vars = c("A","B","C","D"), output = "upset")
# UpSet plot
plt_upset(df, vars = c("A","B","C","D"), output = "upset")
 # Combined (default)
plt_upset(df, vars = c("A","B","C"))
#> Warning: Combined layout failed: Only know how to add <ggplot> and/or <grob> objects.
#> Returning plots separately.
# Combined (default)
plt_upset(df, vars = c("A","B","C"))
#> Warning: Combined layout failed: Only know how to add <ggplot> and/or <grob> objects.
#> Returning plots separately.
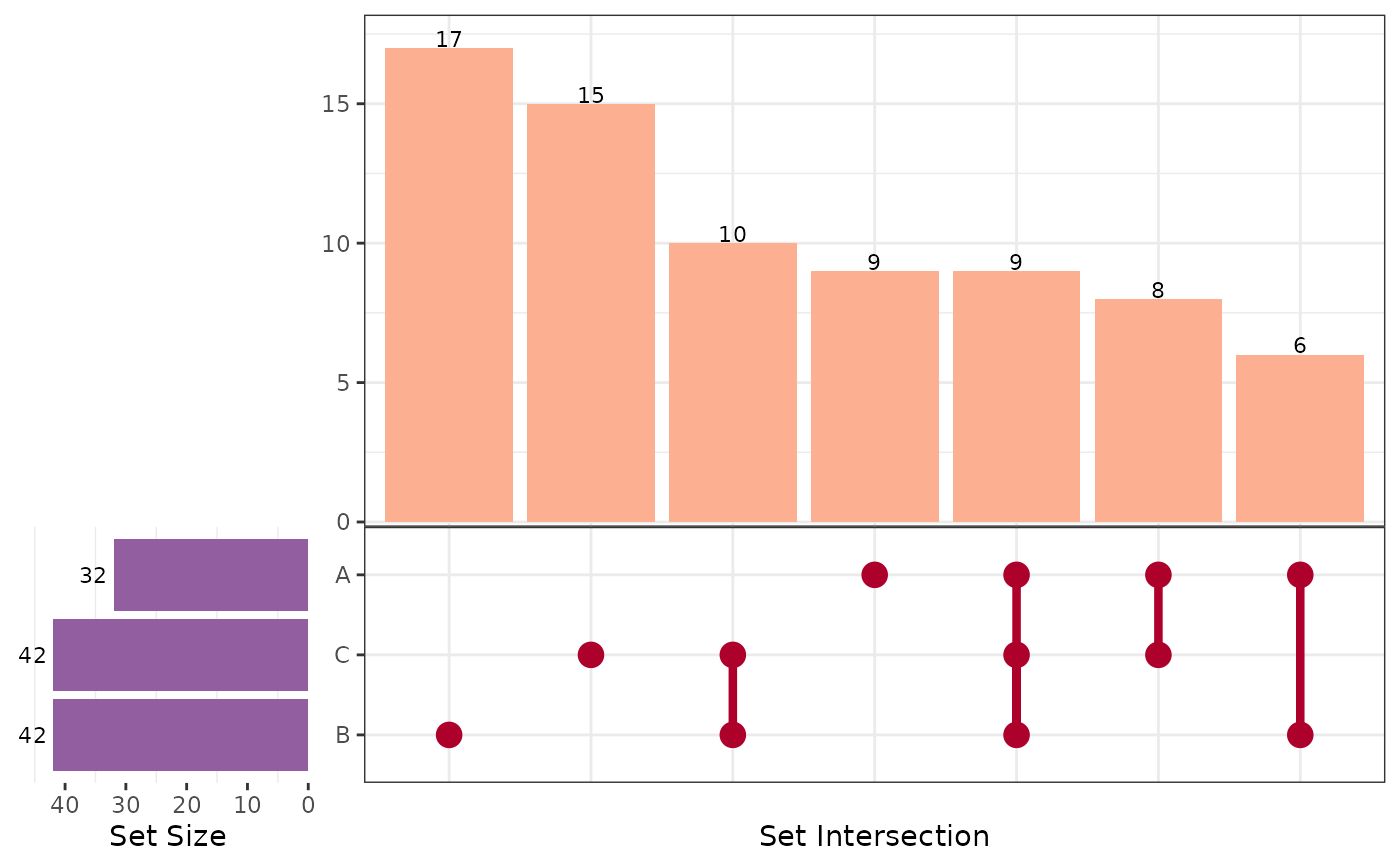 # Get data with intersection groups
result <- plt_upset(df, vars = c("A","B","C"), output = "data")
table(result$intersect_group)
#>
#> B C B/C A A/B/C A/C A/B None
#> 17 15 10 9 9 8 6 26
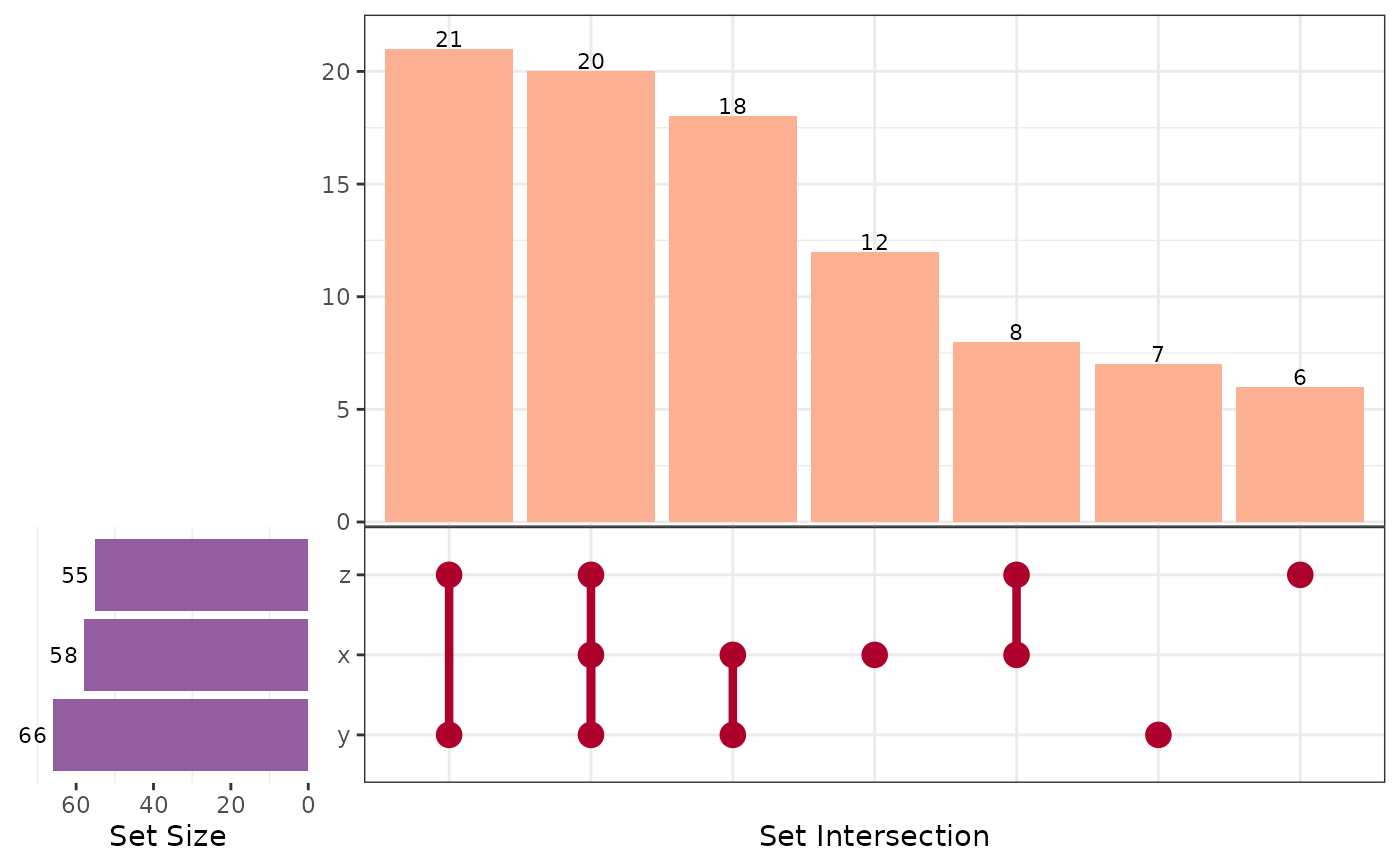
# Custom membership levels
df2 <- data.frame(
x = sample(0:1, 100, TRUE),
y = sample(0:1, 100, TRUE),
z = sample(0:1, 100, TRUE)
)
plt_upset(df2, vars = c("x","y","z"), levels = c("1"))
#> Warning: Combined layout failed: Only know how to add <ggplot> and/or <grob> objects.
#> Returning plots separately.
# Get data with intersection groups
result <- plt_upset(df, vars = c("A","B","C"), output = "data")
table(result$intersect_group)
#>
#> B C B/C A A/B/C A/C A/B None
#> 17 15 10 9 9 8 6 26
# Custom membership levels
df2 <- data.frame(
x = sample(0:1, 100, TRUE),
y = sample(0:1, 100, TRUE),
z = sample(0:1, 100, TRUE)
)
plt_upset(df2, vars = c("x","y","z"), levels = c("1"))
#> Warning: Combined layout failed: Only know how to add <ggplot> and/or <grob> objects.
#> Returning plots separately.
 # All outputs
res <- plt_upset(df, vars = c("A","B","C","D"), output = "all")
#> Warning: Combined layout failed: Only know how to add <ggplot> and/or <grob> objects.
#> Returning plots separately.
names(res)
#> [1] "venn" "upset" "combined" "data"
# All outputs
res <- plt_upset(df, vars = c("A","B","C","D"), output = "all")
#> Warning: Combined layout failed: Only know how to add <ggplot> and/or <grob> objects.
#> Returning plots separately.
names(res)
#> [1] "venn" "upset" "combined" "data"