Visualise the flow/proportion changes across multiple categorical variables using a Sankey (alluvial) diagram. Each node label shows the level name, count, and percentage.
Usage
plt_sankey(
  data,
  vars,
  palette = NULL,
  reverse_levels = TRUE,
  show_n = TRUE,
  width = 0.4,
  label_size = 3,
  label_hjust = 0.5,
  alpha = 0.6,
  base_size = 14
)
Arguments
- data
A data frame.
- vars
Character vector of categorical variable names (>= 2). Variables are displayed left-to-right in the given order.
- palette
Colour palette name from
pal_get(), or a character vector of colours. DefaultNULLauto-generates colours per variable using sequential HCL palettes.- reverse_levels
Logical, reverse factor levels for display. Default
TRUE.- show_n
Logical, show count in node labels. Default
TRUE.- width
Sankey node width. Default 0.4.
- label_size
Label text size. Default 3.
- label_hjust
Label horizontal justification. Default 0.5.
- alpha
Flow transparency. Default 0.6.
- base_size
Base font size. Default 14.
See also
Other plot:
PlotButterfly(),
PlotButterfly2(),
PlotRankCor(),
plt_cat(),
plt_cohen(),
plt_con(),
plt_dist(),
plt_radar(),
plt_upset()
Examples
df <- data.frame(
sex = factor(sample(c("M","F"), 200, TRUE)),
stage = factor(sample(c("I","II","III"), 200, TRUE)),
grade = factor(sample(c("Low","High"), 200, TRUE))
)
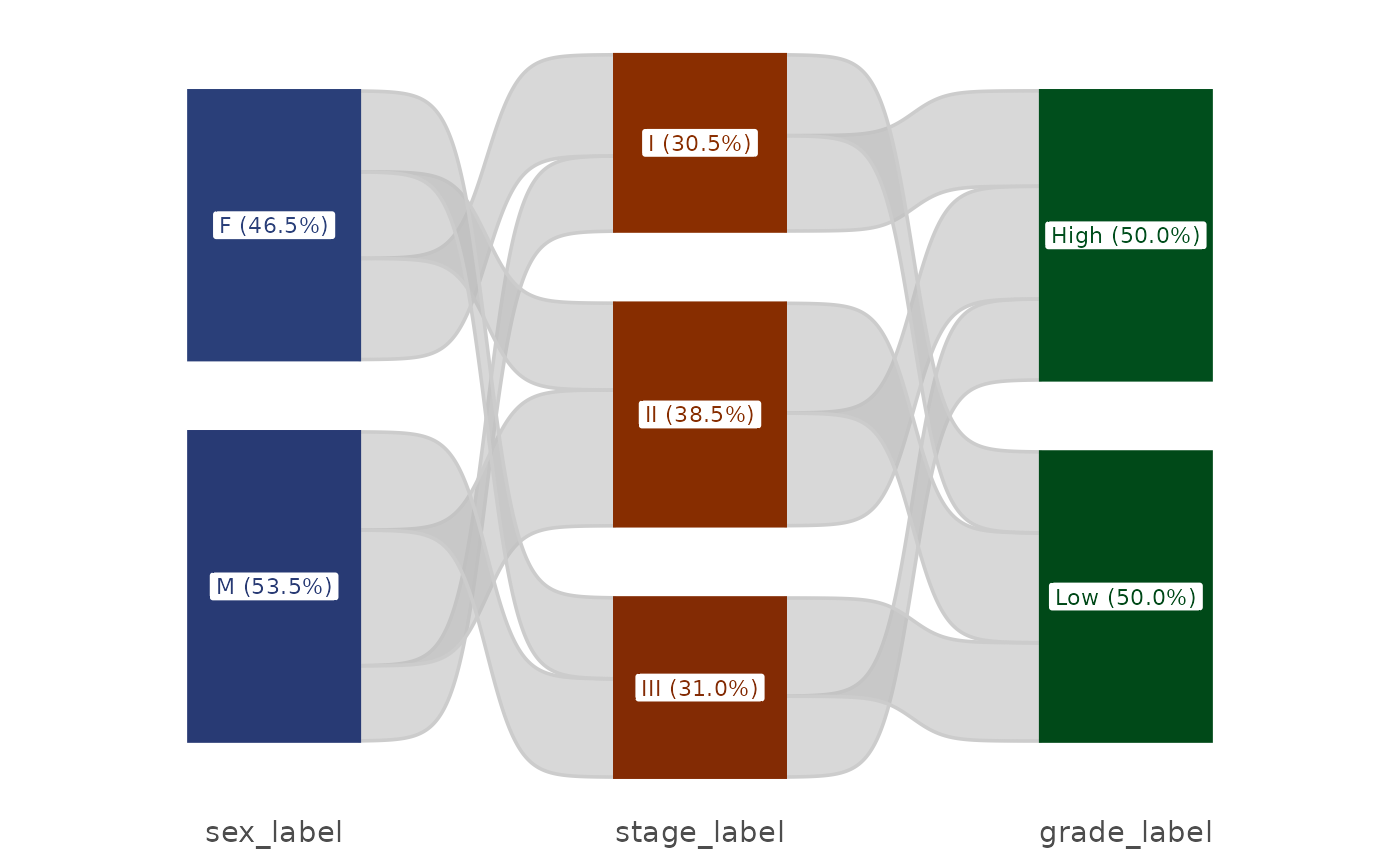
# Basic sankey
plt_sankey(df, vars = c("sex", "stage", "grade"))
#> Warning: attributes are not identical across measure variables; they will be dropped
#> Warning: The `size` argument of `element_rect()` is deprecated as of ggplot2 3.4.0.
#> ℹ Please use the `linewidth` argument instead.
#> ℹ The deprecated feature was likely used in the ggsankey package.
#> Please report the issue at <https://github.com/davidsjoberg/ggsankey/issues>.
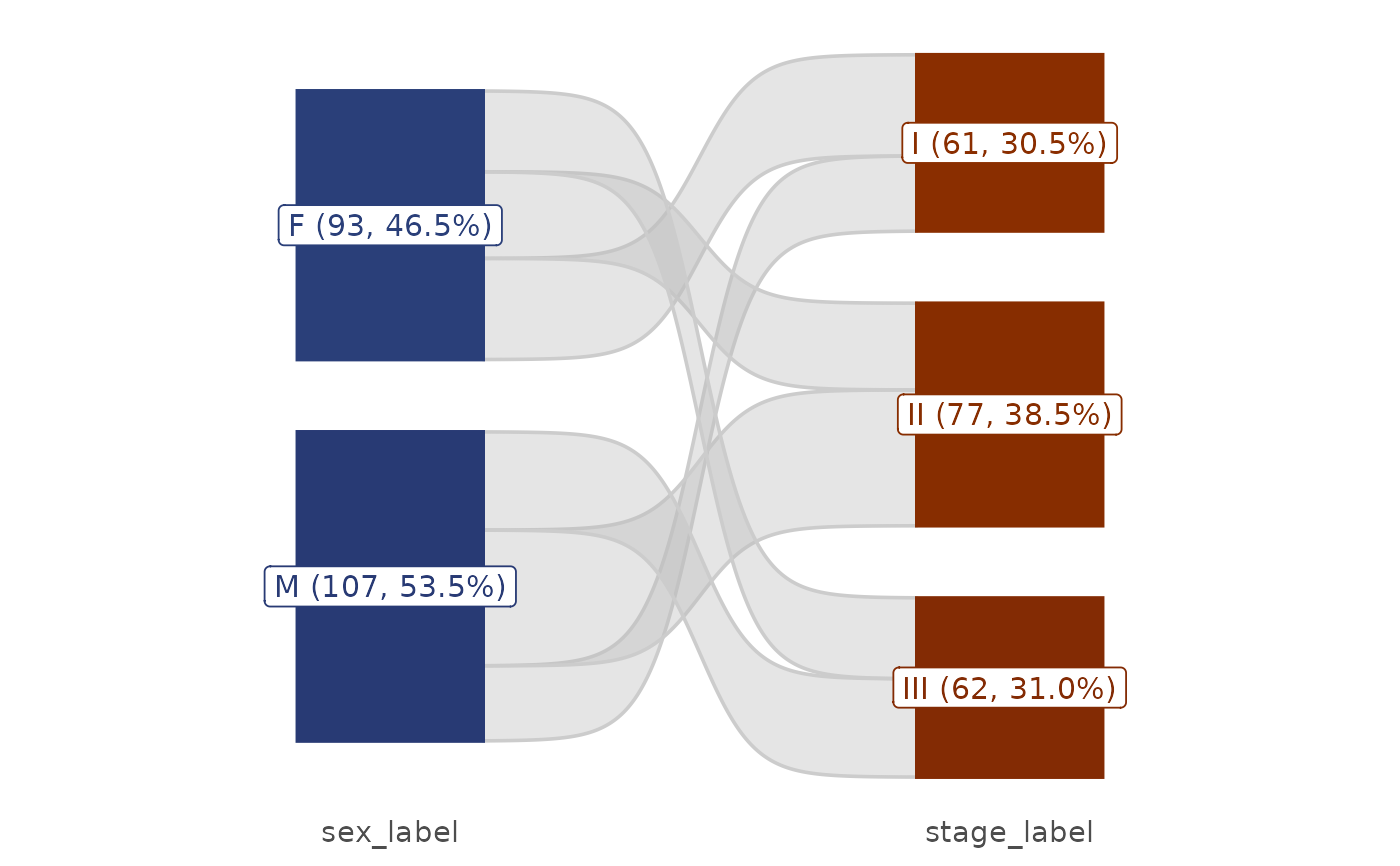
 # Two variables
plt_sankey(df, vars = c("sex", "stage"))
#> Warning: attributes are not identical across measure variables; they will be dropped
# Two variables
plt_sankey(df, vars = c("sex", "stage"))
#> Warning: attributes are not identical across measure variables; they will be dropped
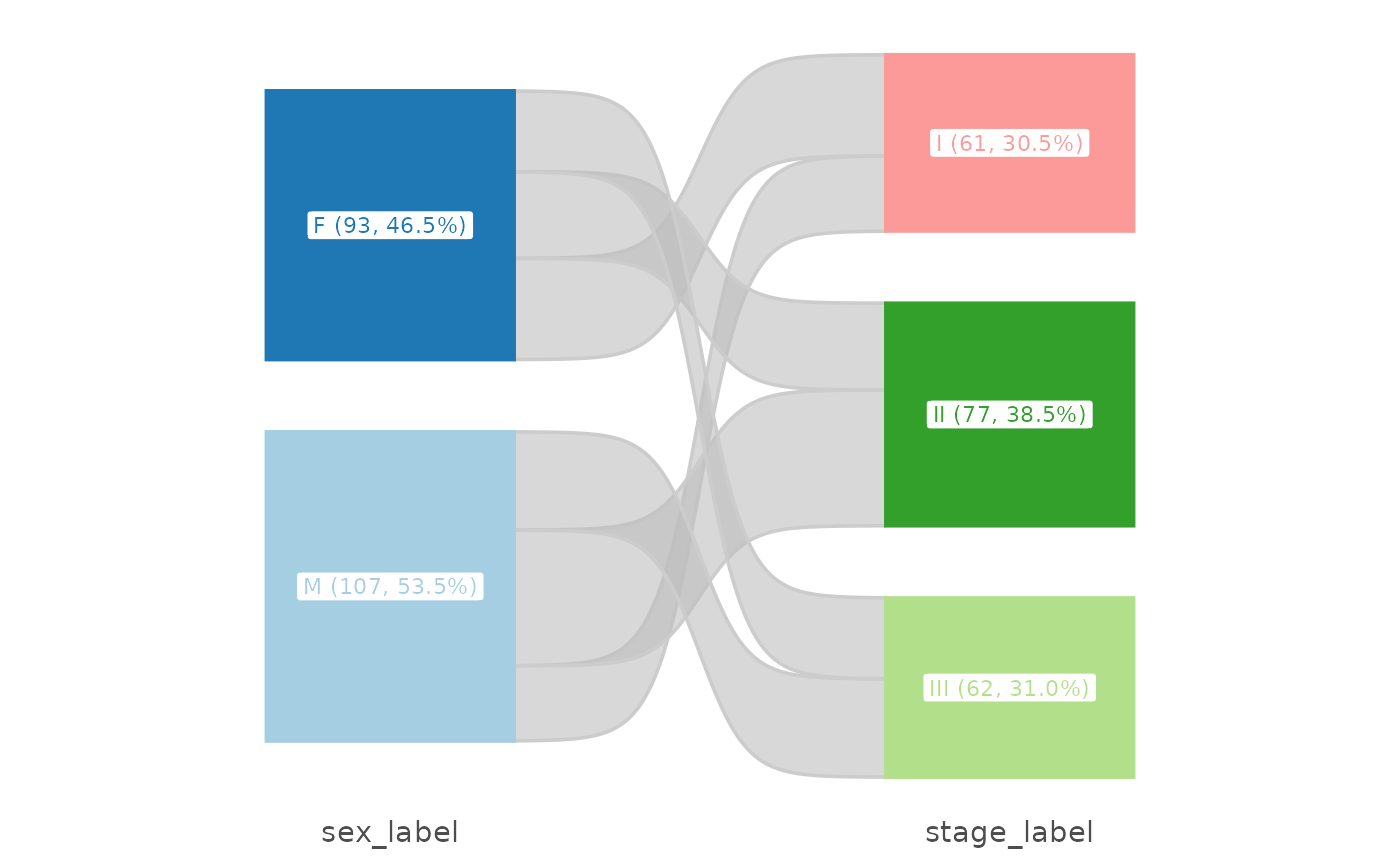
 # Custom palette
plt_sankey(df, vars = c("sex", "stage"), palette = "Paired")
#> Warning: attributes are not identical across measure variables; they will be dropped
# Custom palette
plt_sankey(df, vars = c("sex", "stage"), palette = "Paired")
#> Warning: attributes are not identical across measure variables; they will be dropped
 # Without counts in labels
plt_sankey(df, vars = c("sex", "stage", "grade"), show_n = FALSE)
#> Warning: attributes are not identical across measure variables; they will be dropped
# Without counts in labels
plt_sankey(df, vars = c("sex", "stage", "grade"), show_n = FALSE)
#> Warning: attributes are not identical across measure variables; they will be dropped
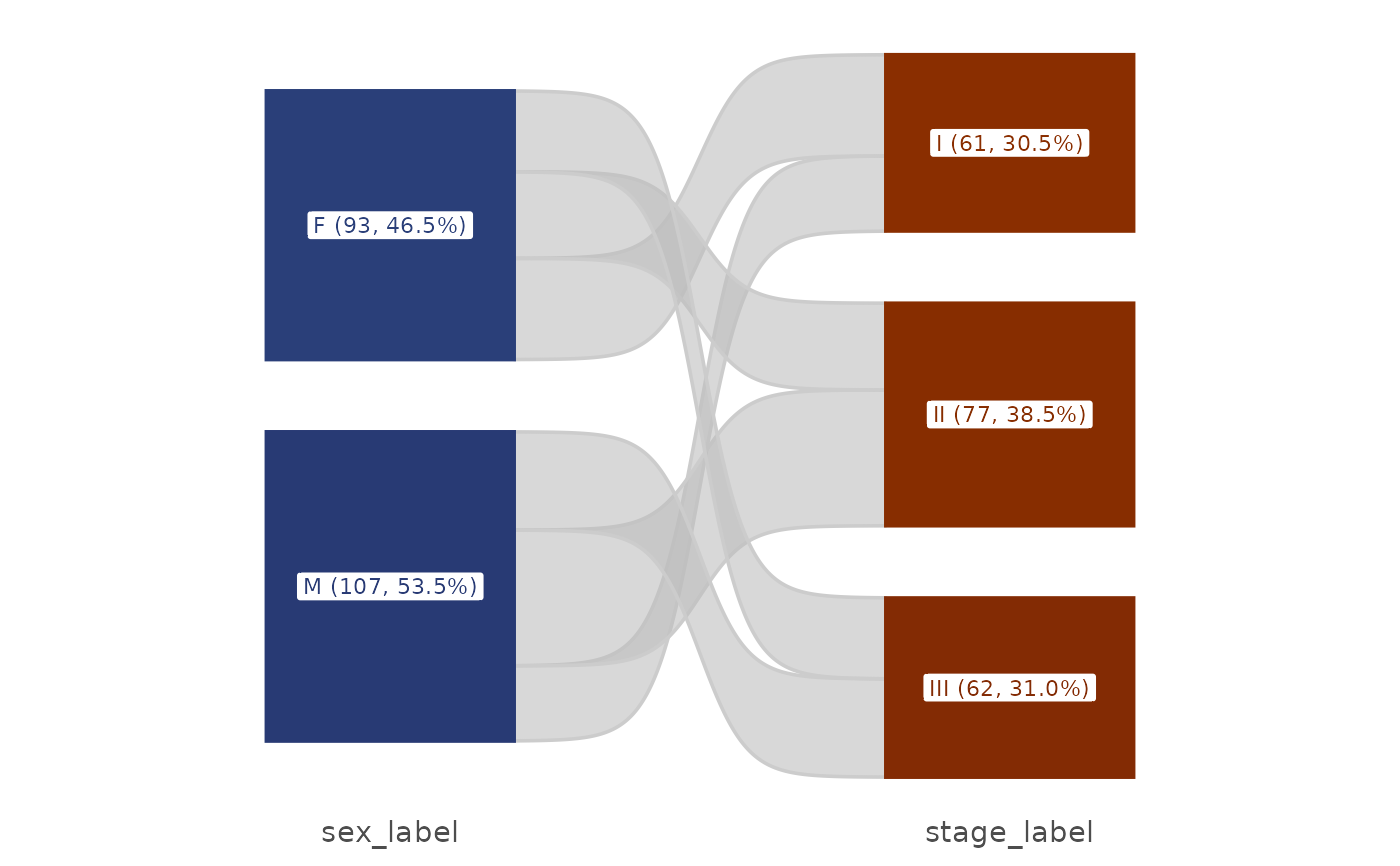
 # Adjust appearance
plt_sankey(df, vars = c("sex", "stage"),
width = 0.3, label_size = 4, alpha = 0.4)
#> Warning: attributes are not identical across measure variables; they will be dropped
# Adjust appearance
plt_sankey(df, vars = c("sex", "stage"),
width = 0.3, label_size = 4, alpha = 0.4)
#> Warning: attributes are not identical across measure variables; they will be dropped