Selectively hide axis text, ticks, and titles for plots in a multi-plot layout. Useful for removing redundant axes when plots share the same scale.
Arguments
- plot
A ggplot, patchwork, or list of ggplot objects.
- x.axis
Logical or integer vector. `FALSE` (default) keeps all x-axes. `TRUE` hides x-axis for all but the last plot. An integer vector specifies which plot indices should have their x-axis hidden.
- y.axis
Logical or integer vector. `FALSE` (default) keeps all y-axes. `TRUE` hides y-axis for all but the first plot. An integer vector specifies which plot indices should have their y-axis hidden.
- plot_dims
Integer vector of length 1 or 2 giving `c(nrow, ncol)` of the layout. When provided, automatically determines which axes to hide: x-axes are hidden for all rows except the last, y-axes for all columns except the first.
See also
Other plot formatting:
fmt_bg(),
fmt_boxplot(),
fmt_com(),
fmt_expand(),
fmt_his(),
fmt_legend(),
fmt_plot(),
fmt_point(),
fmt_ref(),
fmt_scale(),
fmt_strip(),
fmt_tag()
Examples
library(ggplot2)
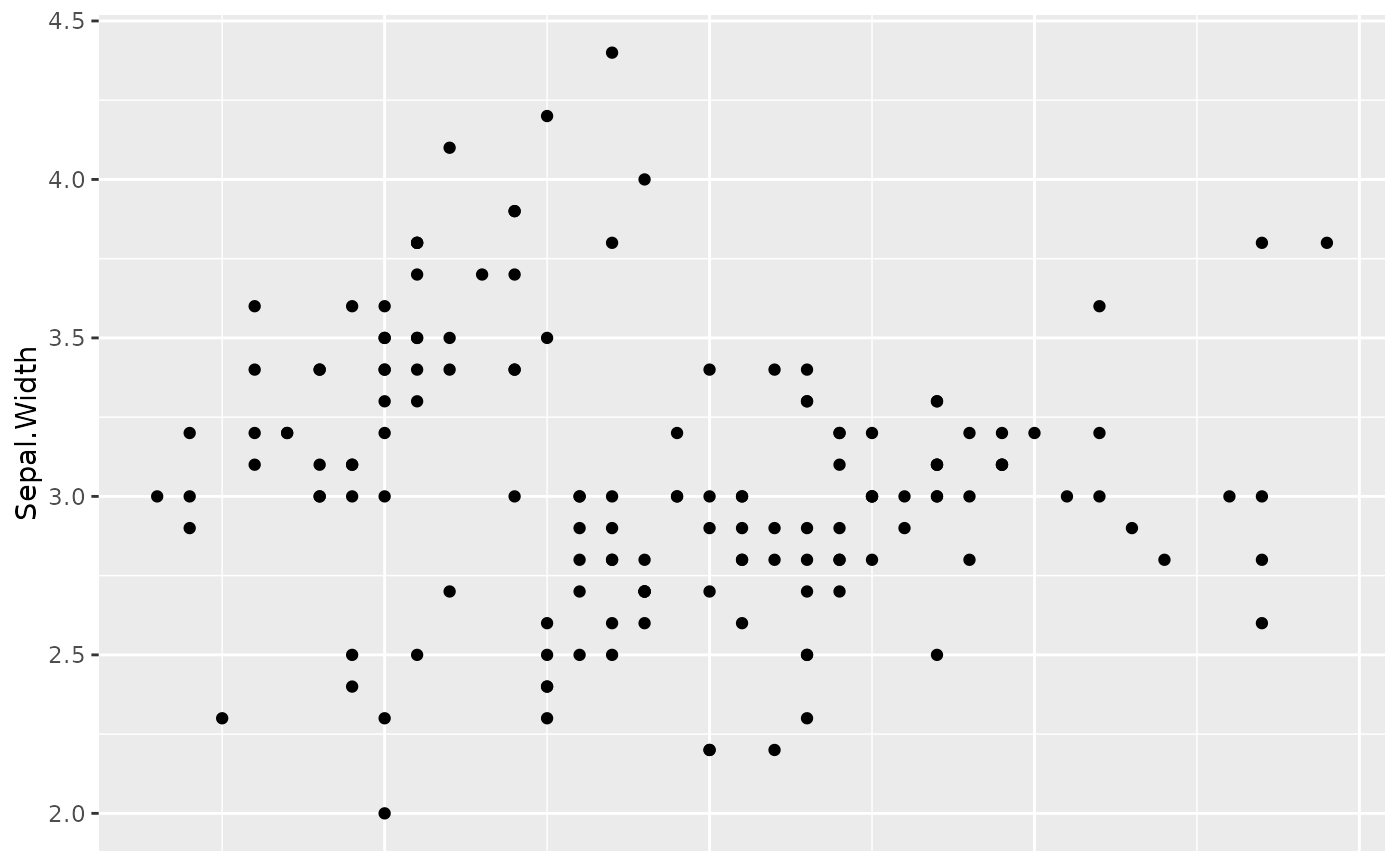
p1 <- ggplot(iris, aes(Sepal.Length, Sepal.Width)) + geom_point()
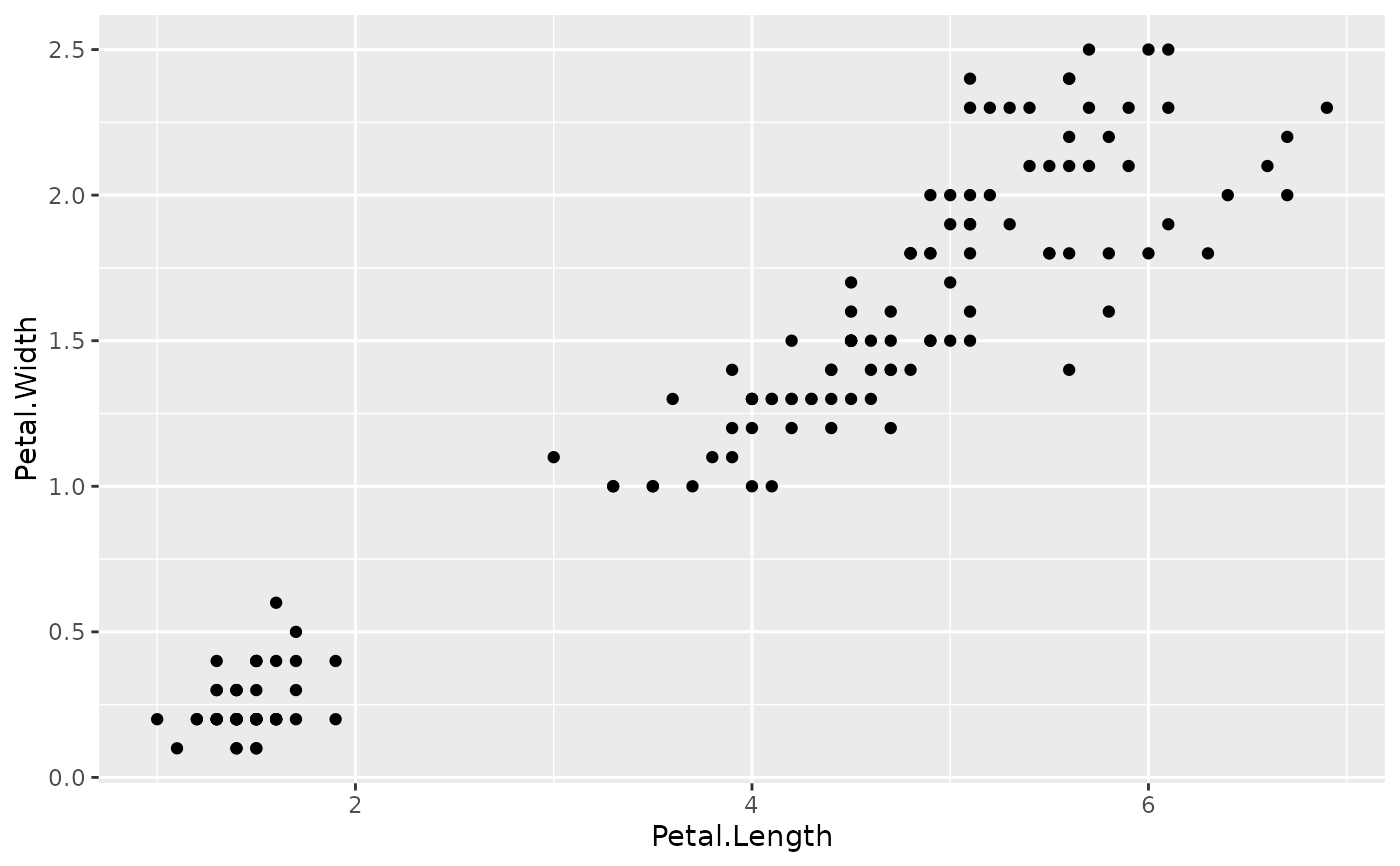
p2 <- ggplot(iris, aes(Petal.Length, Petal.Width)) + geom_point()
# Hide x-axis on first plot
fmt_axis(list(p1, p2), x.axis = 1)
#> [[1]]
 #>
#> [[2]]
#>
#> [[2]]
 #>
# Auto-detect 2x1 grid layout
fmt_axis(list(p1, p2), plot_dims = c(2, 1))
#> [[1]]
#>
# Auto-detect 2x1 grid layout
fmt_axis(list(p1, p2), plot_dims = c(2, 1))
#> [[1]]
 #>
#> [[2]]
#>
#> [[2]]
 #>
#>