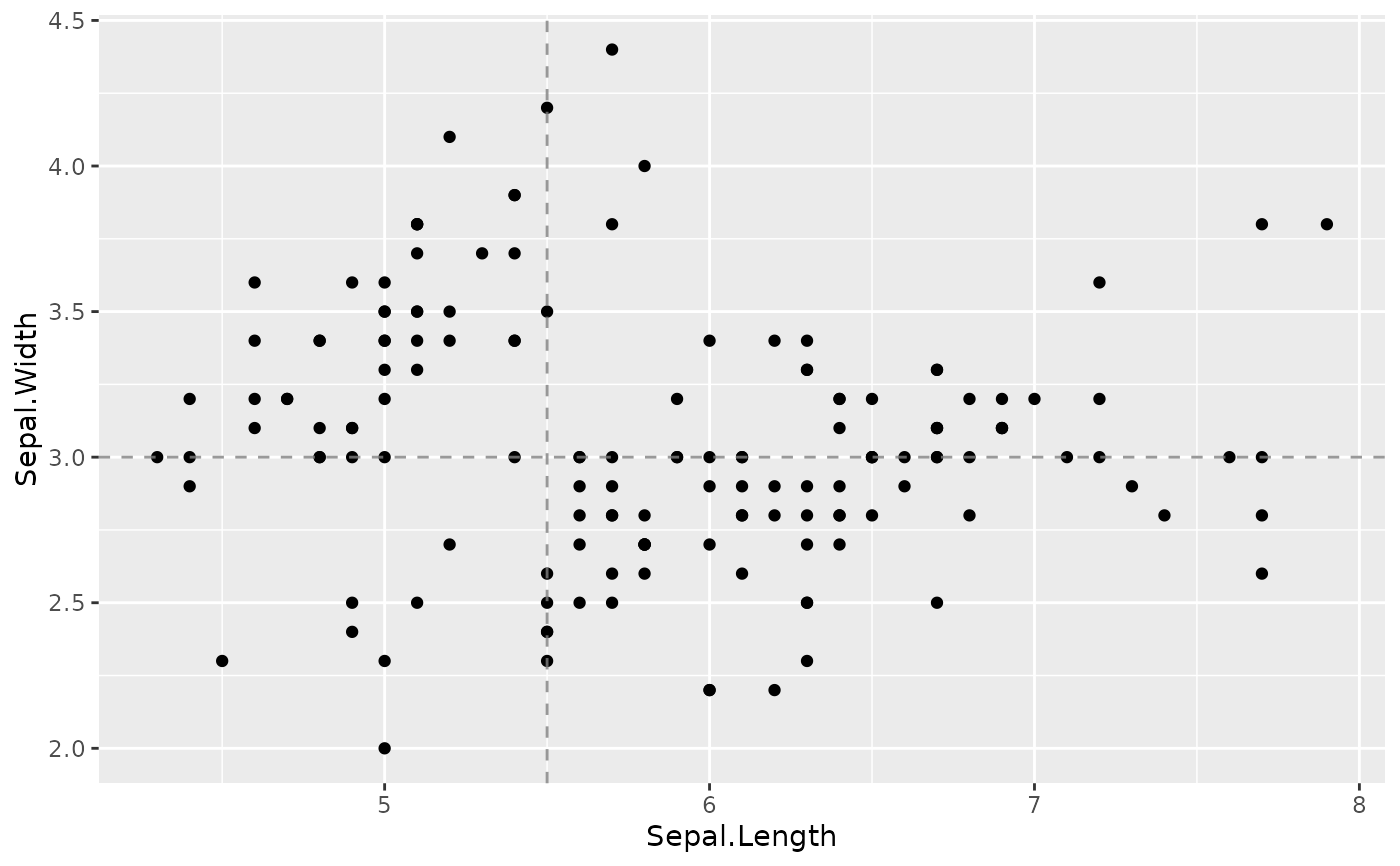
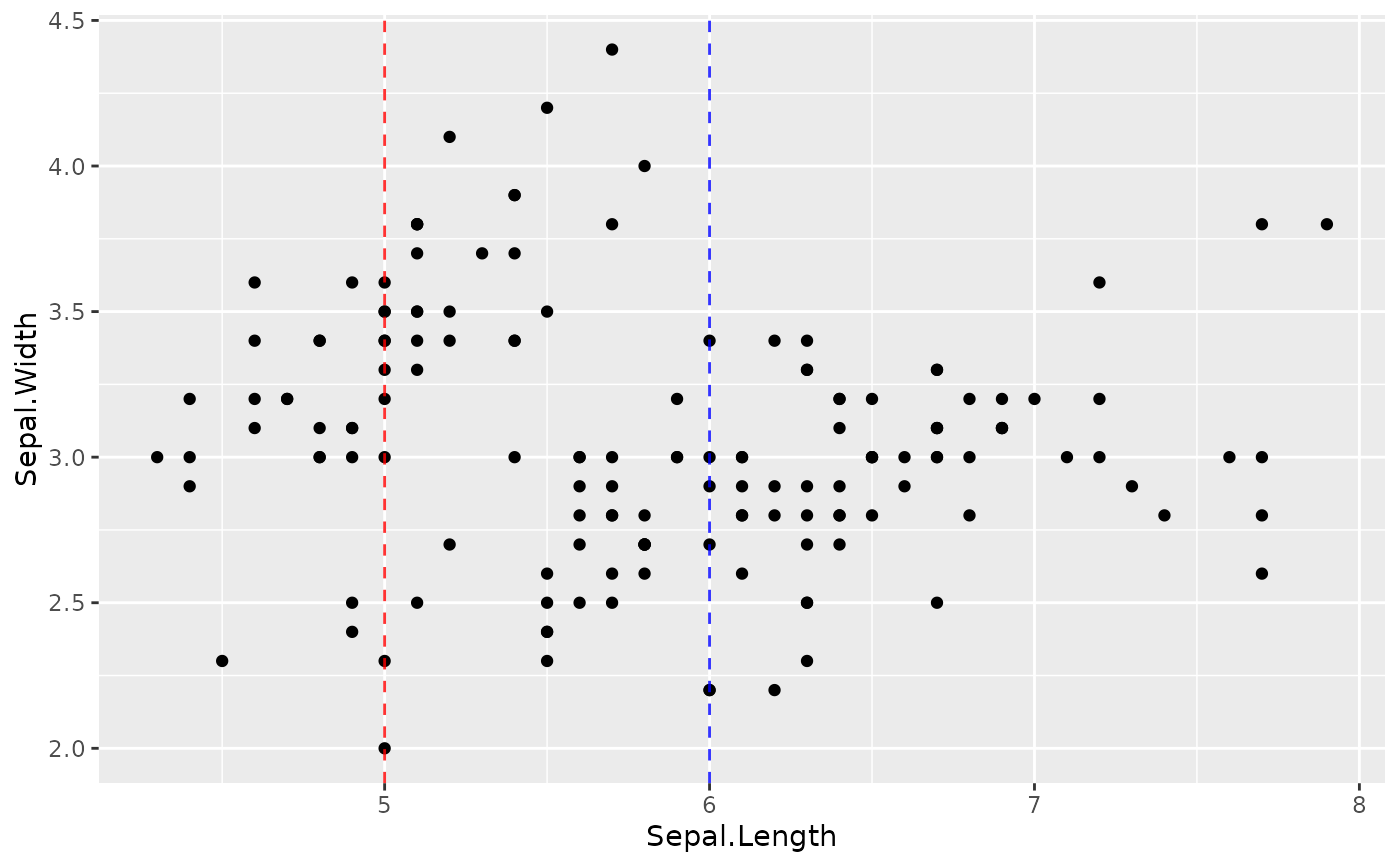
Add vertical and/or horizontal reference lines to one or more plots. When multiple intercept values are provided with matching per-line colors, each line is added individually so that colors are applied correctly.
Usage
fmt_ref(
  plot,
  x = NULL,
  y = NULL,
  linetype = "dashed",
  linewidth = 0.5,
  color = "gray50",
  alpha = 0.8,
  ...
)
Arguments
- plot
A ggplot, patchwork, or list of ggplot objects.
- x
Numeric vector of x-intercept values for vertical lines, or `NULL`.
- y
Numeric vector of y-intercept values for horizontal lines, or `NULL`.
- linetype
Line type. Default `"dashed"`.
- linewidth
Line width. Default `0.5`.
- color
Line color(s). Recycled to match the number of intercepts. Default `"gray50"`.
- alpha
Line transparency. Default `0.8`.
- ...
Additional arguments passed to [ggplot2::geom_vline()] or [ggplot2::geom_hline()].
See also
Other plot formatting:
fmt_axis(),
fmt_bg(),
fmt_boxplot(),
fmt_com(),
fmt_expand(),
fmt_his(),
fmt_legend(),
fmt_plot(),
fmt_point(),
fmt_scale(),
fmt_strip(),
fmt_tag()