Add text labels (e.g. A, B, C) to the corner of each plot panel using [ggpp::annotate()] with NPC coordinates.
Usage
fmt_tag(
  plot,
  labels = NULL,
  label_position = c(0.02, 0.98),
  size = 16,
  color = "black",
  fontface = "bold",
  ...
)
Arguments
- plot
A ggplot, patchwork, or list of ggplot objects.
- labels
Character vector of labels. If `NULL` (default), uses `LETTERS[1:n]`.
- label_position
Numeric vector of length 2 giving NPC coordinates `c(x, y)` for label placement. Default `c(0.02, 0.98)` is top-left.
- size
Numeric label size in points. Default 16.
- color
Label text color. Default `"black"`.
- fontface
Font face for labels. Default `"bold"`.
- ...
Additional arguments passed to [ggpp::annotate()].
See also
Other plot formatting:
fmt_axis(),
fmt_bg(),
fmt_boxplot(),
fmt_com(),
fmt_expand(),
fmt_his(),
fmt_legend(),
fmt_plot(),
fmt_point(),
fmt_ref(),
fmt_scale(),
fmt_strip()
Examples
library(ggplot2)
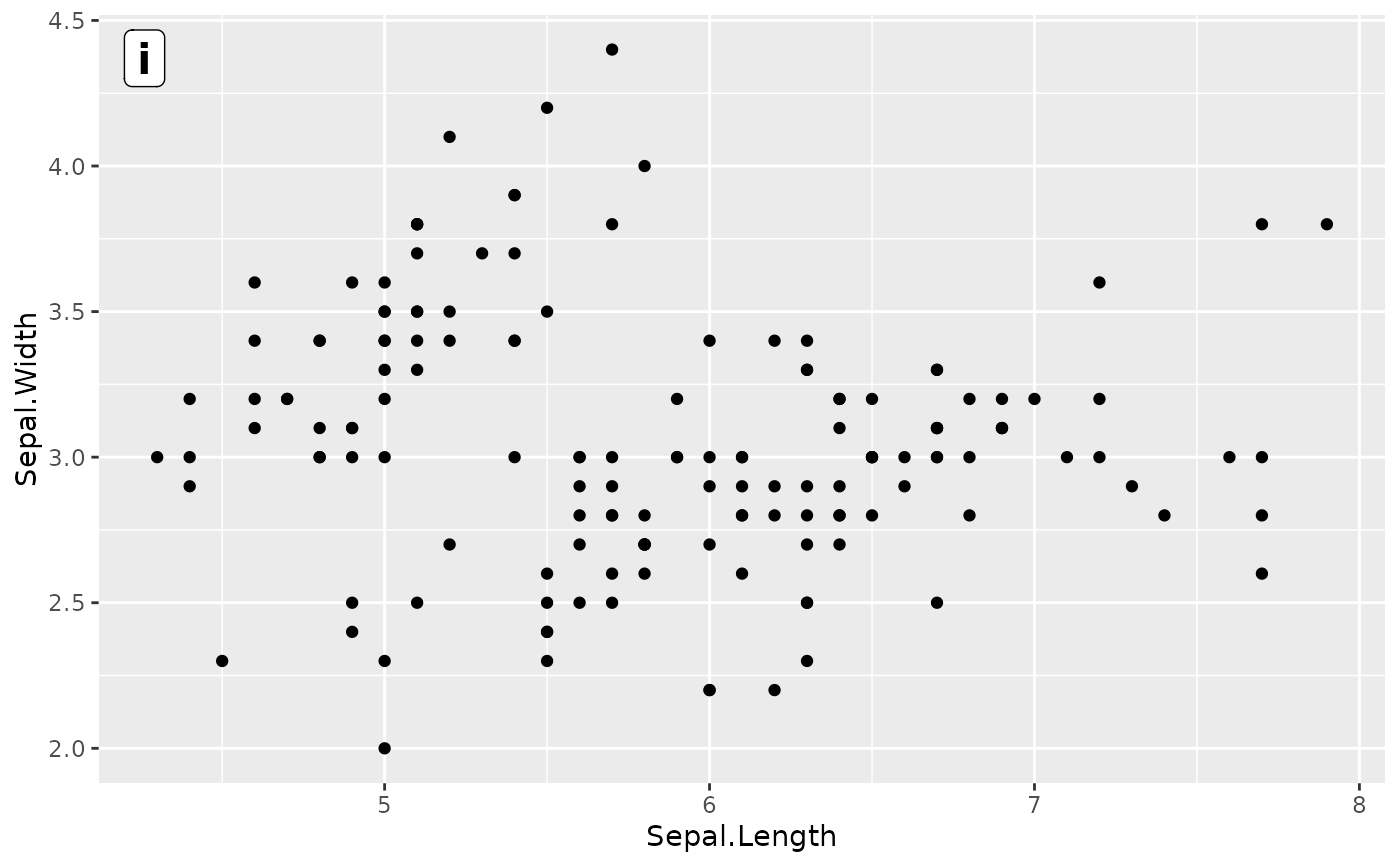
p1 <- ggplot(iris, aes(Sepal.Length, Sepal.Width)) + geom_point()
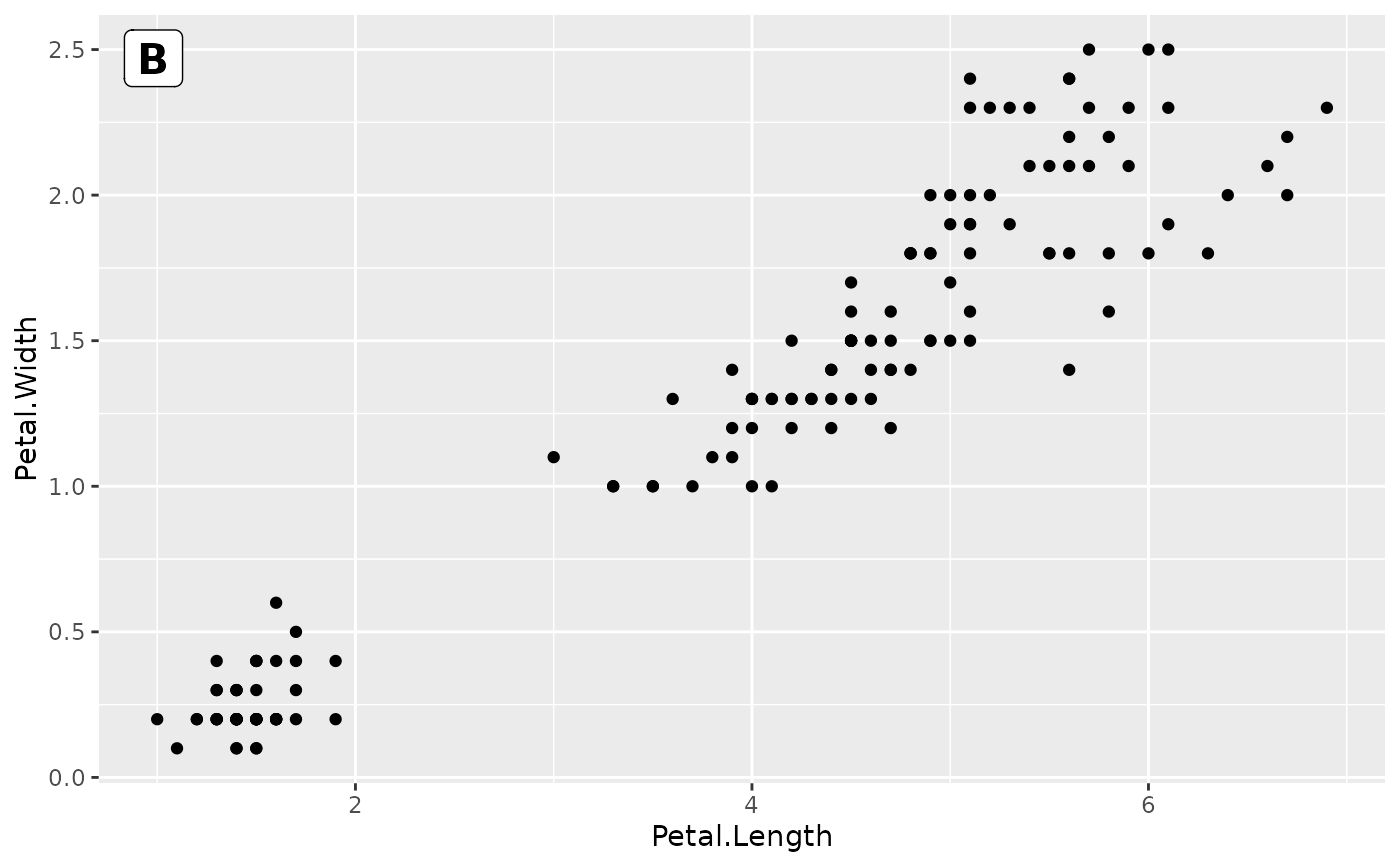
p2 <- ggplot(iris, aes(Petal.Length, Petal.Width)) + geom_point()
# Auto-label A, B
fmt_tag(list(p1, p2))
#> Registered S3 methods overwritten by 'ggpp':
#> method from
#> heightDetails.titleGrob ggplot2
#> widthDetails.titleGrob ggplot2
#> [[1]]
 #>
#> [[2]]
#>
#> [[2]]
 #>
# Custom labels
fmt_tag(list(p1, p2), labels = c("i", "ii"))
#> [[1]]
#>
# Custom labels
fmt_tag(list(p1, p2), labels = c("i", "ii"))
#> [[1]]
 #>
#> [[2]]
#>
#> [[2]]
 #>
#>