Unified function to overlay data points on ggplot objects. Supports plain points, jittered points, and beeswarm layout. Automatically detects group aesthetics to apply dodge positioning.
Usage
fmt_point(
  plot,
  type = c("point", "jitter", "beeswarm"),
  data = NULL,
  shape = 19,
  size = 1,
  white_border = FALSE,
  dodge.width = 0.8,
  jitter.args = list(width = 0.2, height = 0),
  beeswarm.args = list(cex = 3, corral = "wrap", corral.width = 0.5),
  sample_n = NULL,
  seed = 42,
  rasterize = FALSE,
  rasterize.dpi = 300,
  ...
)
Arguments
- plot
A ggplot, patchwork, or list of ggplot objects.
- type
Point layout type:
"point"(default),"jitter", or"beeswarm".- data
Data for the point layer. Default
NULLinherits from plot. Can be a data.frame or a function/formula applied to the plot data (e.g.~ subset(.x, value > 10)).- shape
Point shape. Default 19 (solid circle).
- size
Point size. Default 1.
- white_border
Logical. If
TRUE, converts shapes to fillable versions (21-24) with white stroke. DefaultFALSE.- dodge.width
Dodge width for grouped data. Default 0.8. Set to 0 to disable dodging.
- jitter.args
Named list of jitter arguments. Only used when
type = "jitter". Defaults:list(width = 0.2, height = 0).- beeswarm.args
Named list of beeswarm arguments. Only used when
type = "beeswarm". Defaults:list(cex = 3, corral = "wrap", corral.width = 0.5).- sample_n
Integer or
NULL. When set, randomly subsample data before plotting to reduce overplotting. If the plot has a group aesthetic (color/fill), sampling is stratified:sample_npoints are taken per group. Groups with fewer points are kept in full. DefaultNULL(no sampling).- seed
Random seed for reproducible sampling. Default 42.
- rasterize
Logical. If
TRUE, rasterizes the point layer viaggrastr::rasterisefor large datasets. DefaultFALSE.- rasterize.dpi
Integer, DPI for rasterization. Default 300.
- ...
Additional arguments passed to
geom_pointorgeom_beeswarm.
See also
Other plot formatting:
fmt_axis(),
fmt_bg(),
fmt_boxplot(),
fmt_com(),
fmt_expand(),
fmt_his(),
fmt_legend(),
fmt_plot(),
fmt_ref(),
fmt_scale(),
fmt_strip(),
fmt_tag()
Examples
library(ggplot2)
p <- ggplot(iris, aes(Species, Sepal.Length)) + geom_boxplot()
# Plain points
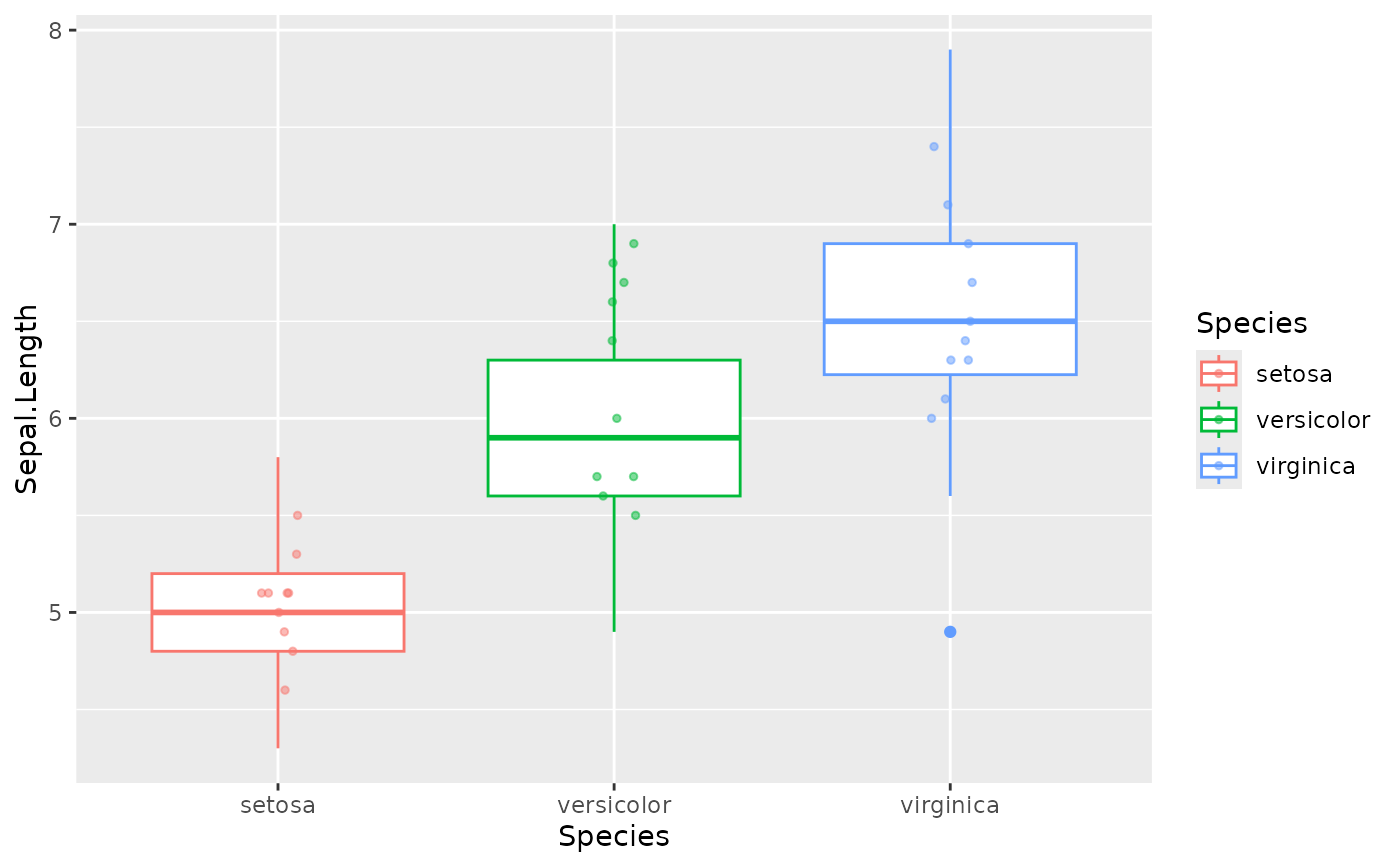
fmt_point(p, color = "steelblue", alpha = 0.5)
 # Jittered points
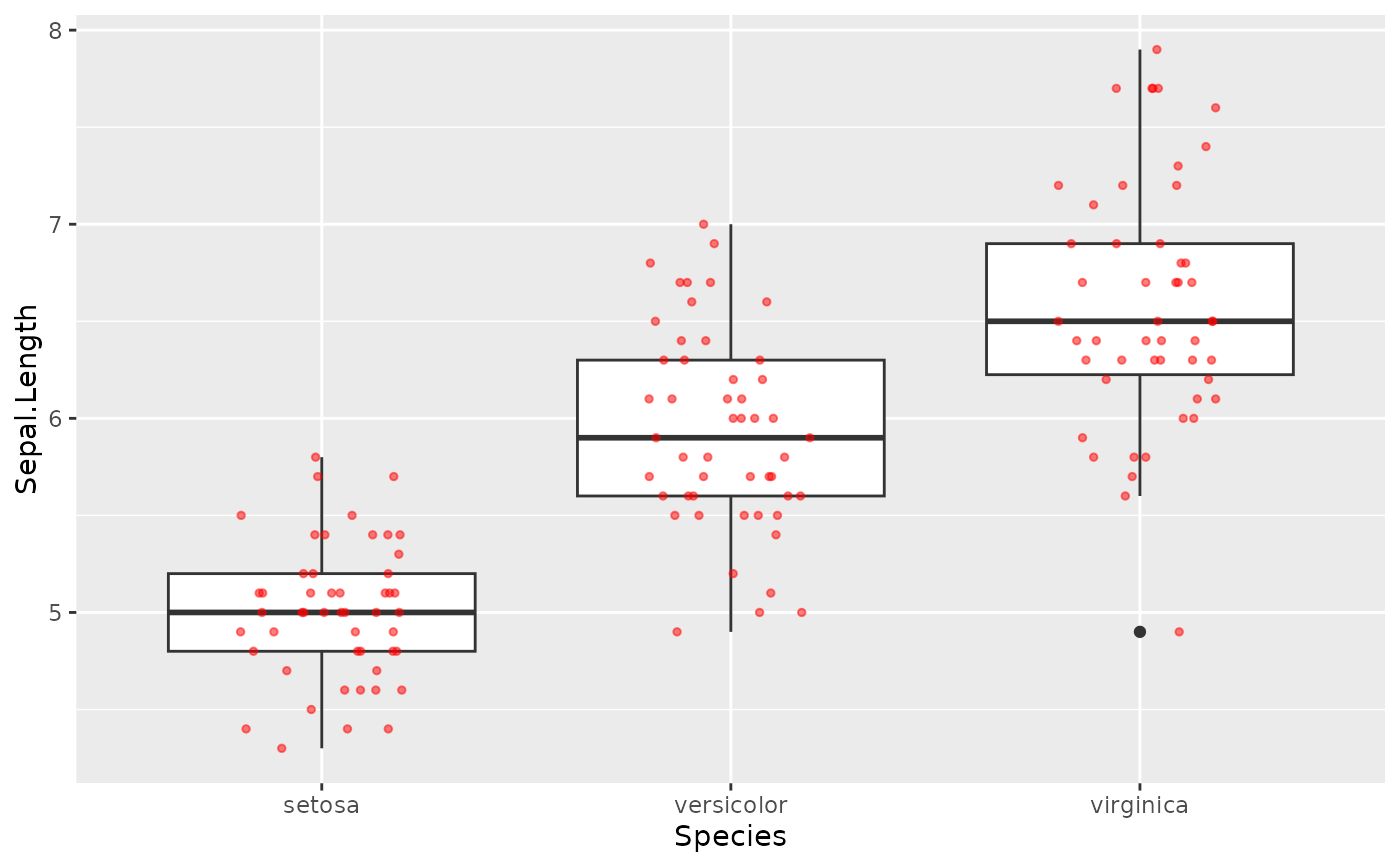
fmt_point(p, type = "jitter", color = "red", alpha = 0.5)
# Jittered points
fmt_point(p, type = "jitter", color = "red", alpha = 0.5)
 # Custom jitter width
fmt_point(p, type = "jitter", jitter.args = list(width = 0.4), alpha = 0.5)
# Custom jitter width
fmt_point(p, type = "jitter", jitter.args = list(width = 0.4), alpha = 0.5)
 # Beeswarm
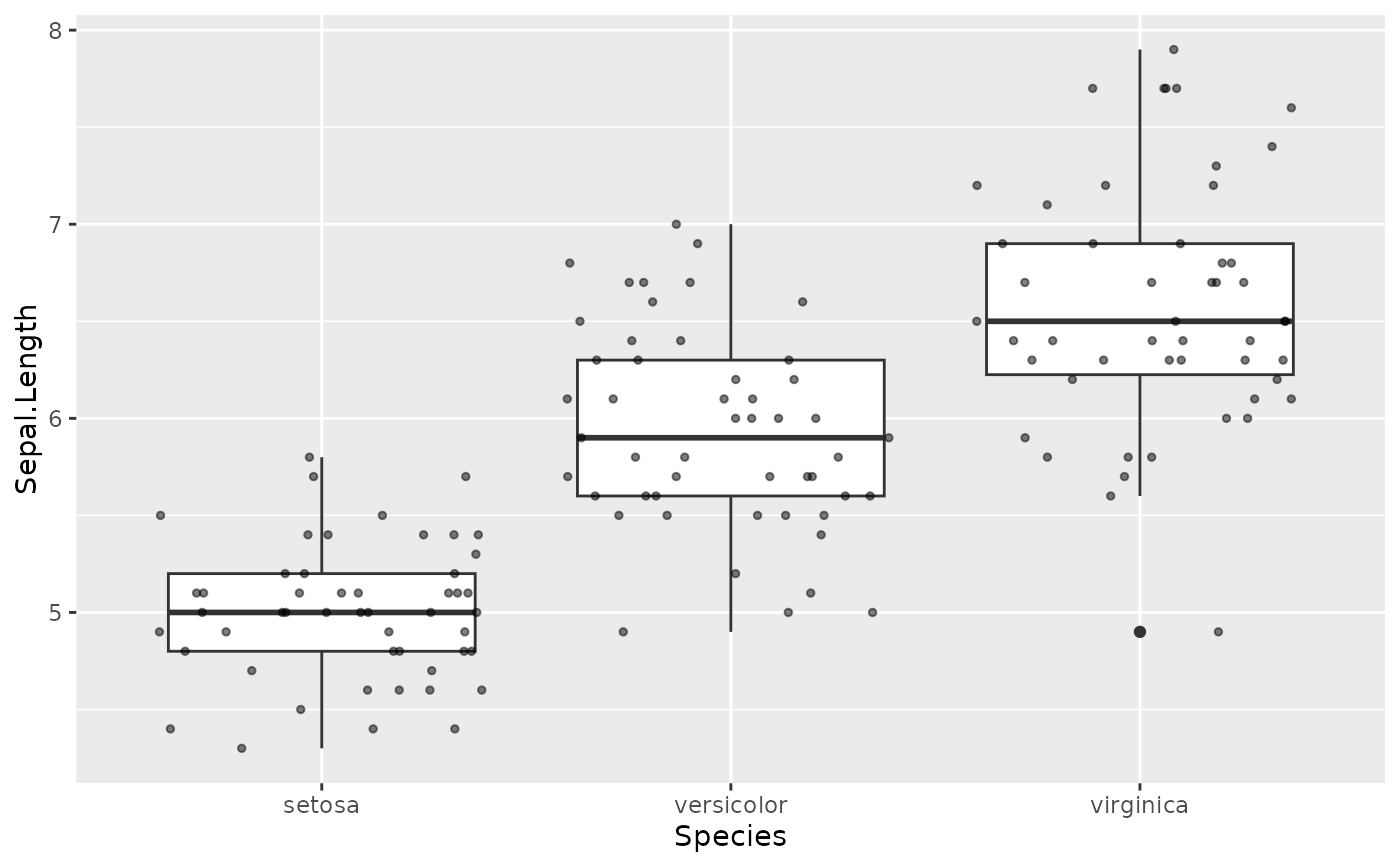
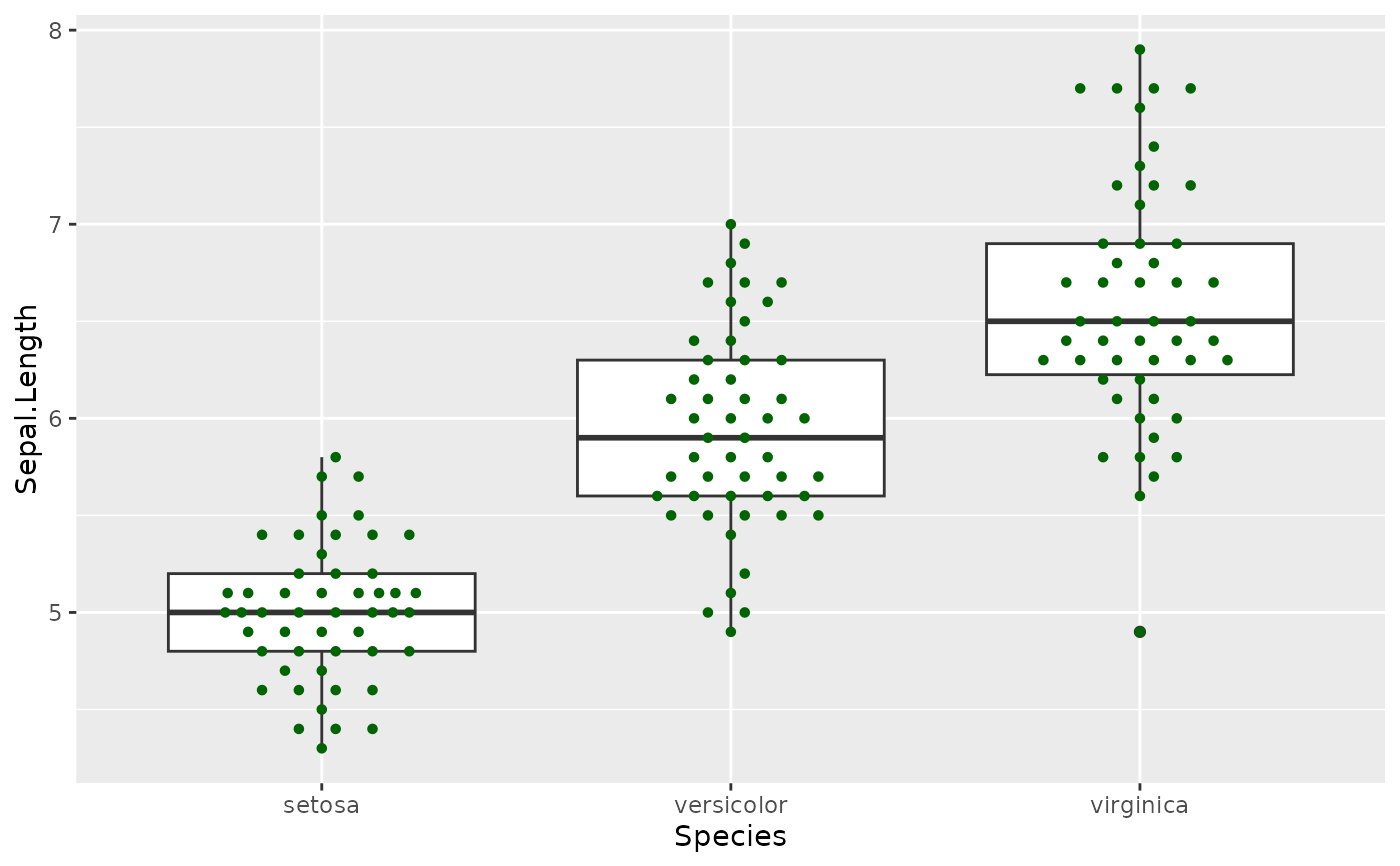
fmt_point(p, type = "beeswarm", color = "darkgreen", size = 1.2)
# Beeswarm
fmt_point(p, type = "beeswarm", color = "darkgreen", size = 1.2)
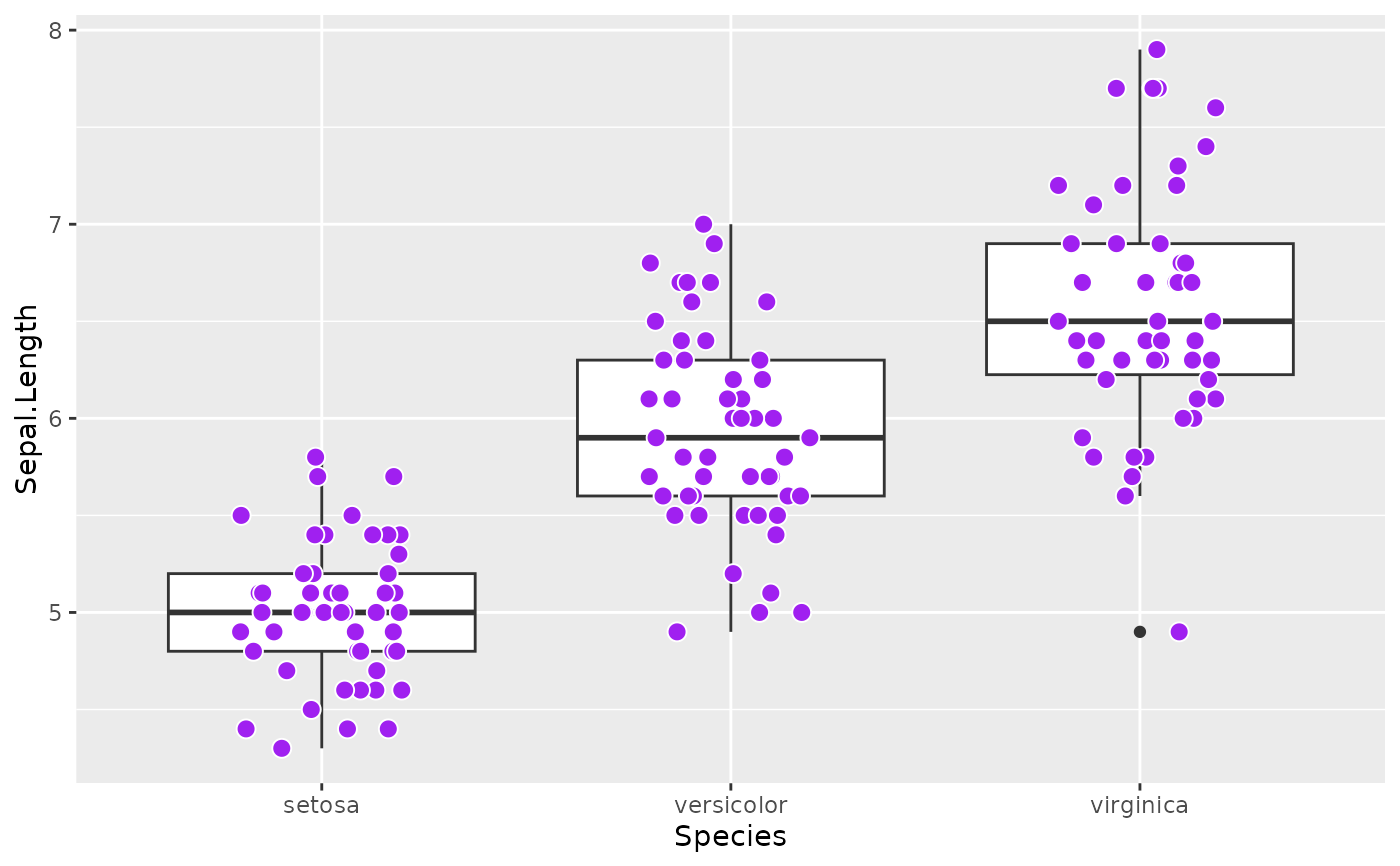
 # White border effect
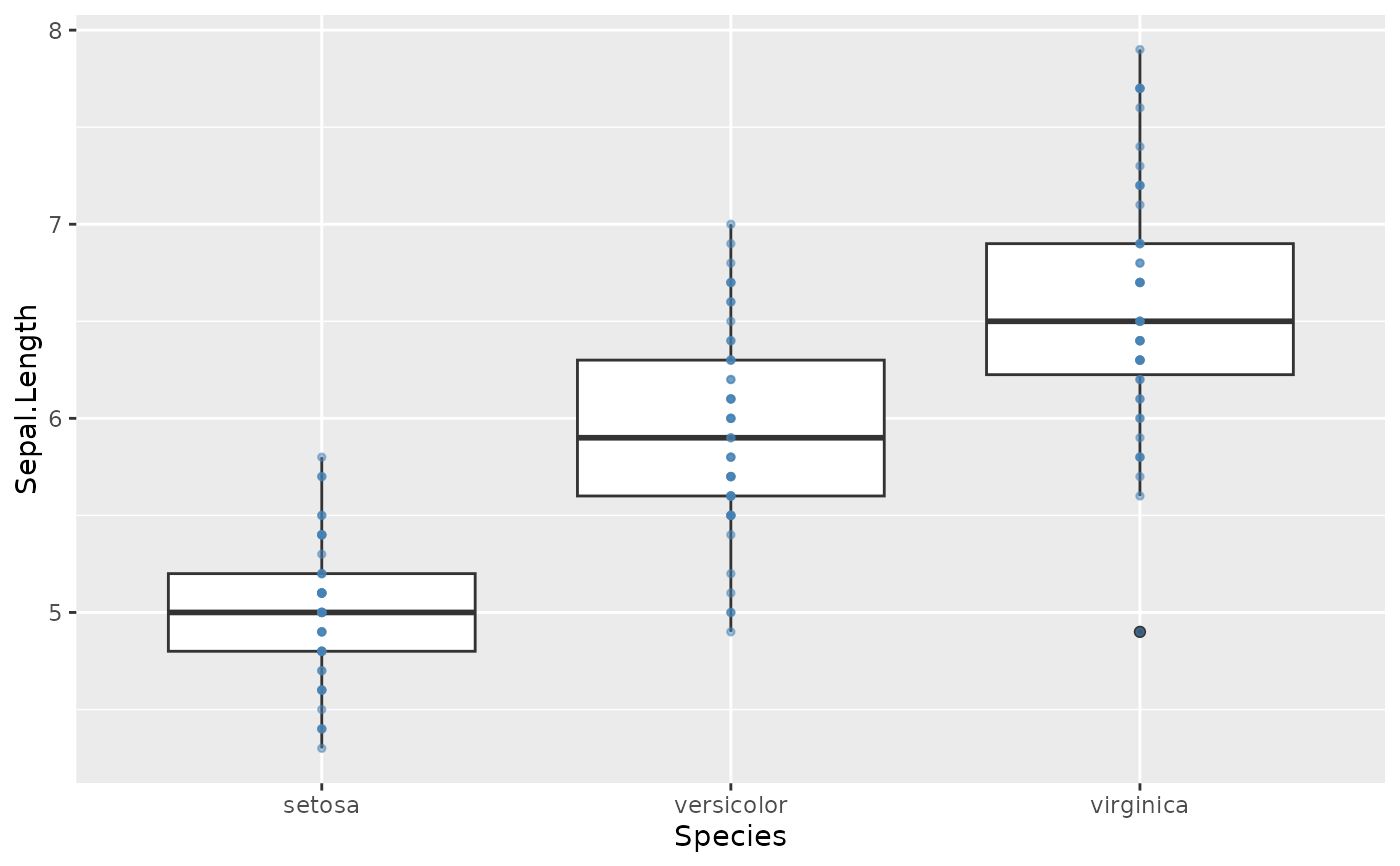
fmt_point(p, type = "jitter", fill = "purple",
white_border = TRUE, size = 2)
# White border effect
fmt_point(p, type = "jitter", fill = "purple",
white_border = TRUE, size = 2)
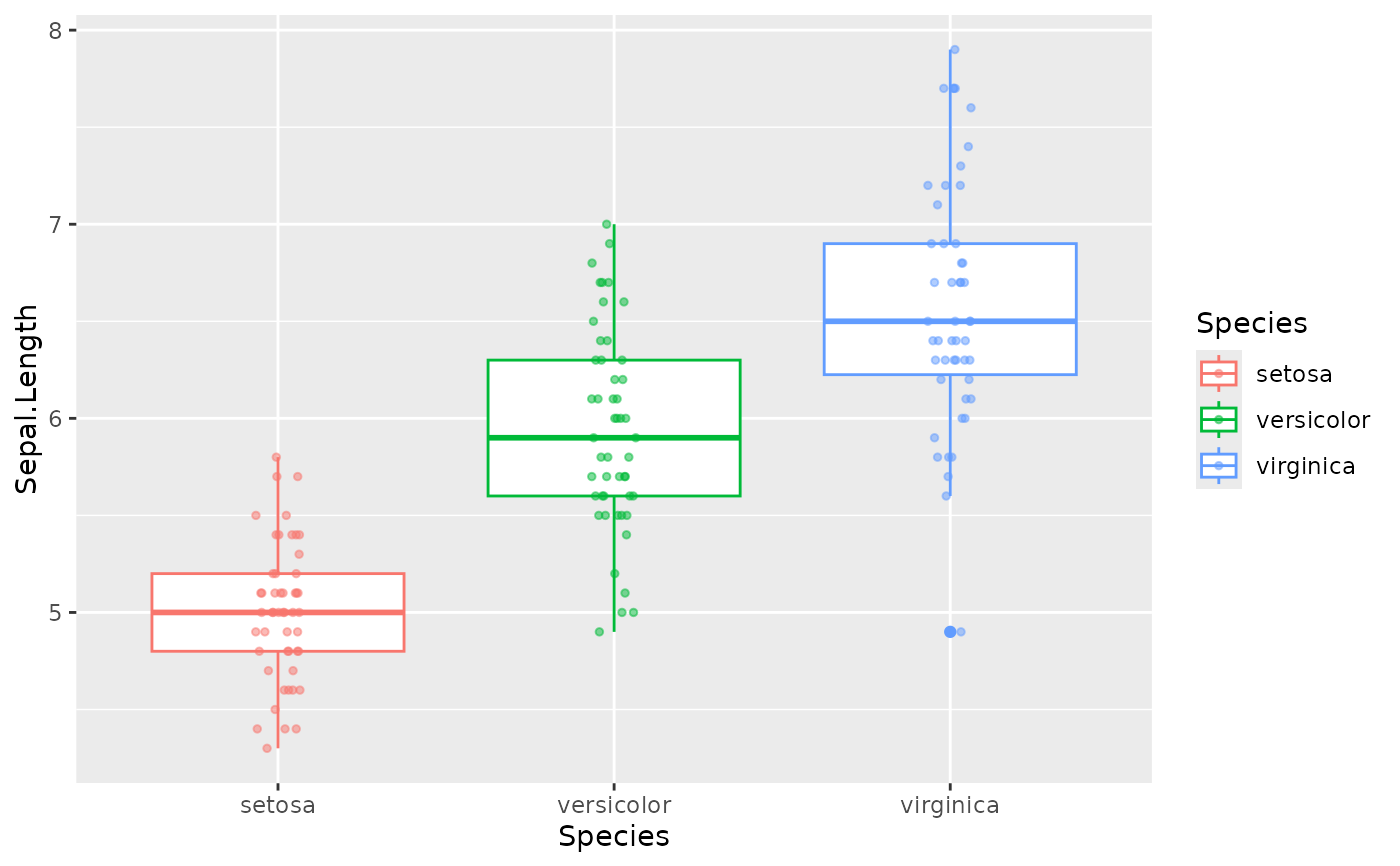
 # Grouped data (auto-dodge)
p2 <- ggplot(iris, aes(Species, Sepal.Length, color = Species)) +
geom_boxplot()
fmt_point(p2, type = "jitter", alpha = 0.5)
# Grouped data (auto-dodge)
p2 <- ggplot(iris, aes(Species, Sepal.Length, color = Species)) +
geom_boxplot()
fmt_point(p2, type = "jitter", alpha = 0.5)
 # Subsample when too many points
fmt_point(p, type = "jitter", sample_n = 20, alpha = 0.5)
# Subsample when too many points
fmt_point(p, type = "jitter", sample_n = 20, alpha = 0.5)
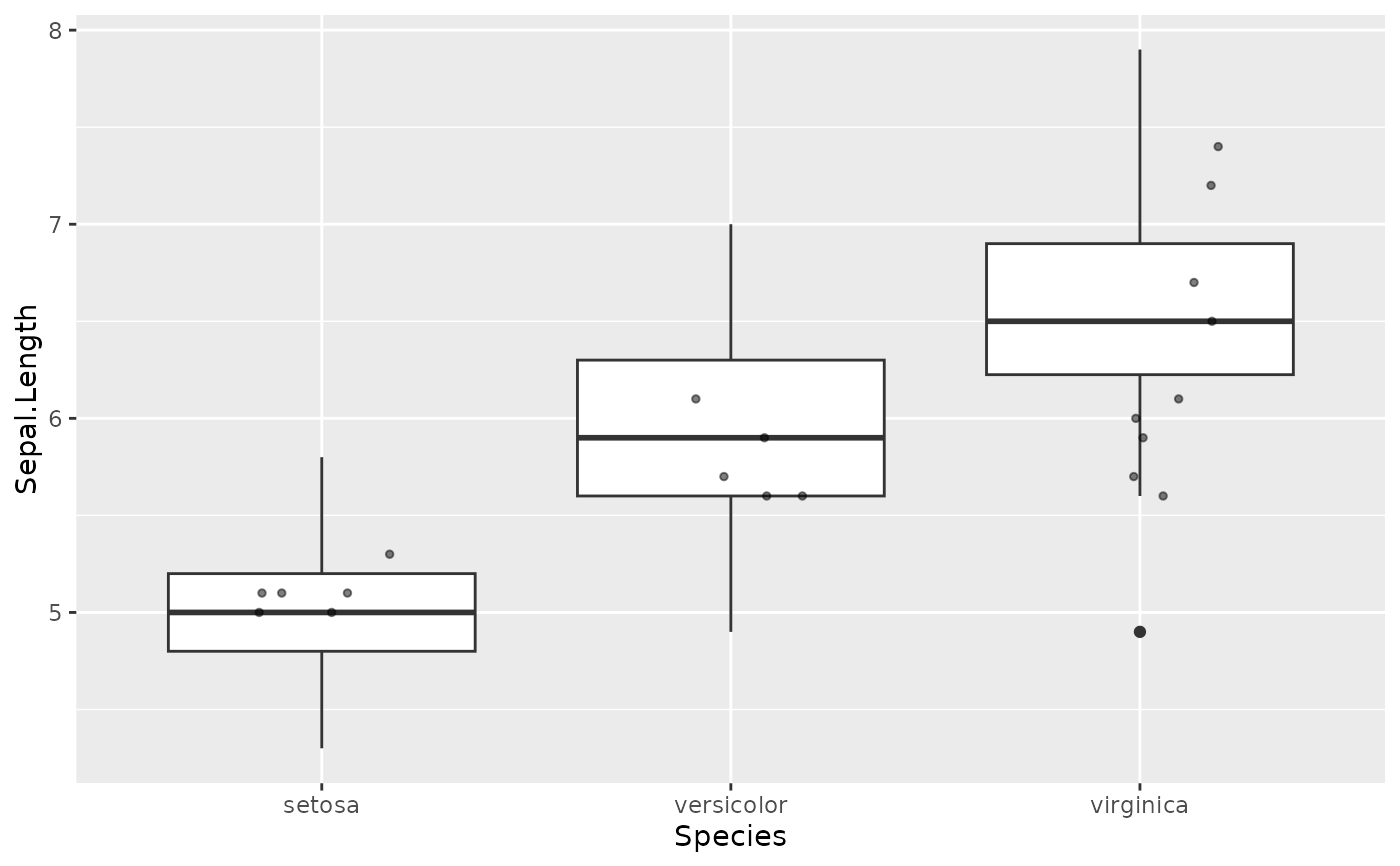 # Stratified sampling (per group)
fmt_point(p2, type = "jitter", sample_n = 10, alpha = 0.5)
# Stratified sampling (per group)
fmt_point(p2, type = "jitter", sample_n = 10, alpha = 0.5)