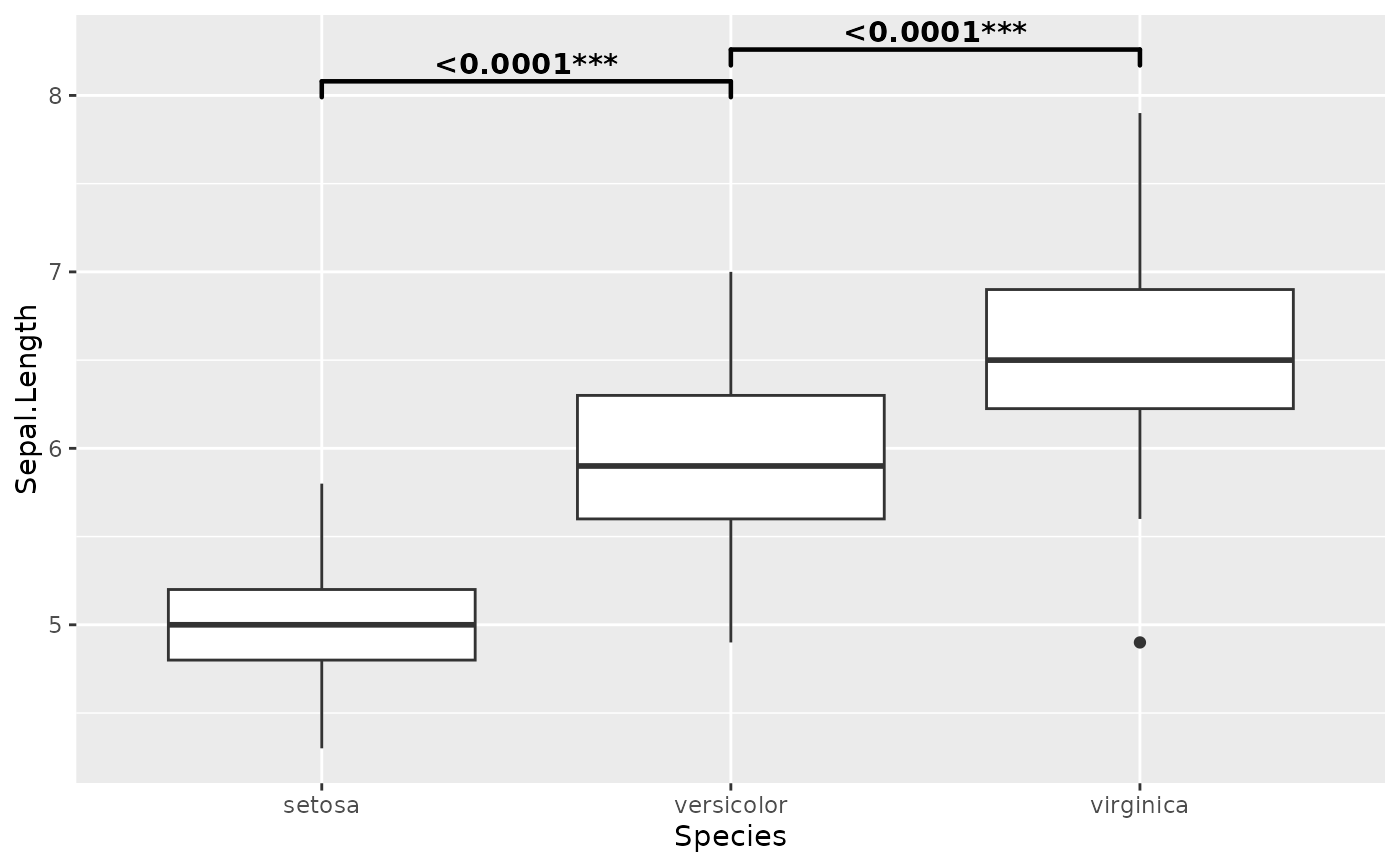
Uses ggpubr::geom_pwc to overlay significance brackets.
Usage
fmt_com(
  plot,
  com_method = "con",
  label.y = NULL,
  label = c("p.signif", "{p.format}{p.signif}", "p.format"),
  ...
)
Arguments
- plot
A ggplot, patchwork, or list of ggplots.
- com_method
Comparison method:
"con"(consecutive),"all"(all pairs), or a list of length-2 character vectors.- label.y
Numeric y-position for the first bracket (absolute y-axis value, not proportion). Default
NULLlets ggpubr auto-calculate.- label
Label type:
"p.signif","\{p.format\}\{p.signif\}", or"p.format".- ...
Additional arguments passed to
ggpubr::geom_pwc.
See also
Other plot formatting:
fmt_axis(),
fmt_bg(),
fmt_boxplot(),
fmt_expand(),
fmt_his(),
fmt_legend(),
fmt_plot(),
fmt_point(),
fmt_ref(),
fmt_scale(),
fmt_strip(),
fmt_tag()
Examples
library(ggplot2)
p <- ggplot(iris, aes(Species, Sepal.Length)) + geom_boxplot()
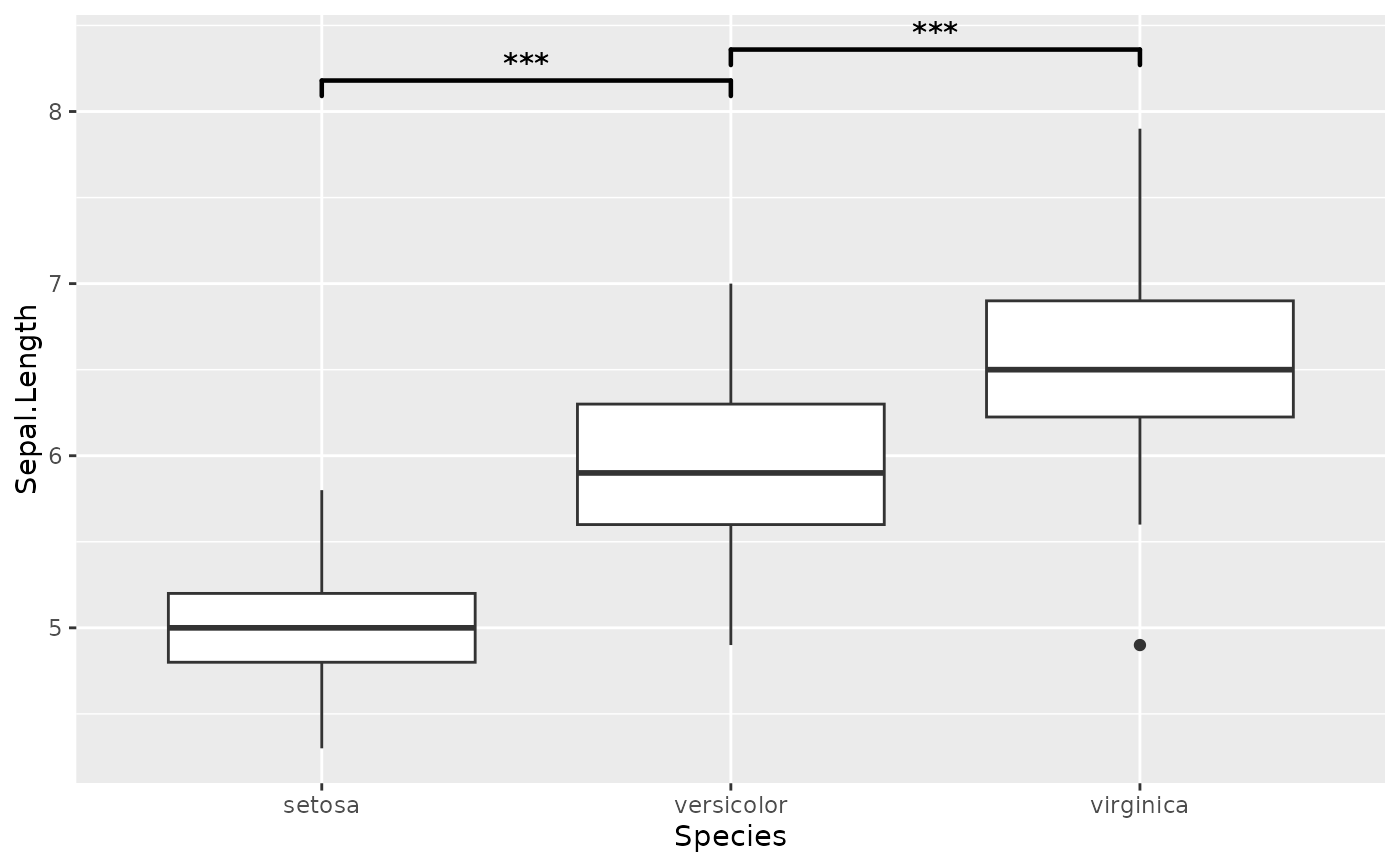
# Consecutive comparisons (default)
fmt_com(p)
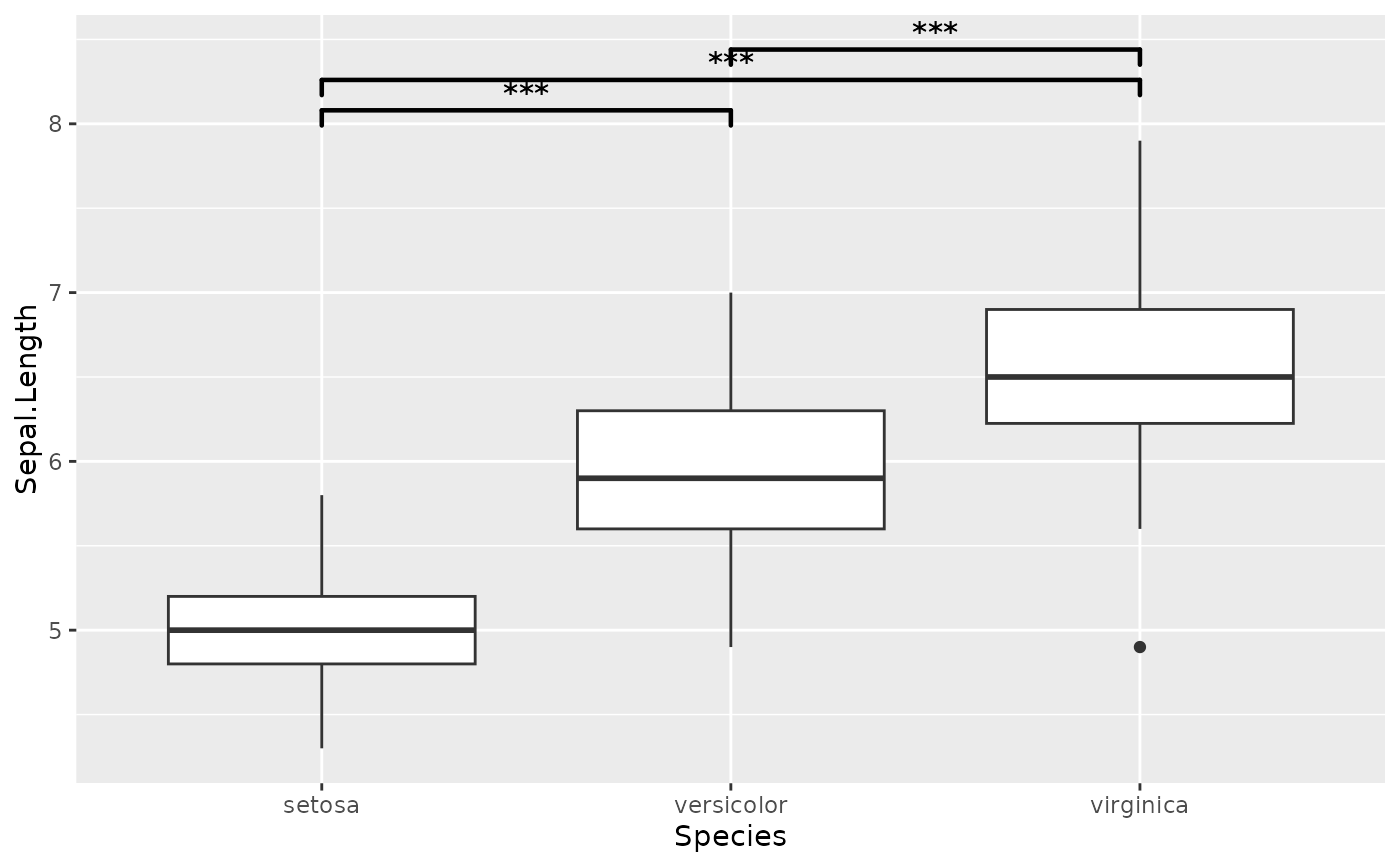
 # All pairwise comparisons
fmt_com(p, com_method = "all")
# All pairwise comparisons
fmt_com(p, com_method = "all")
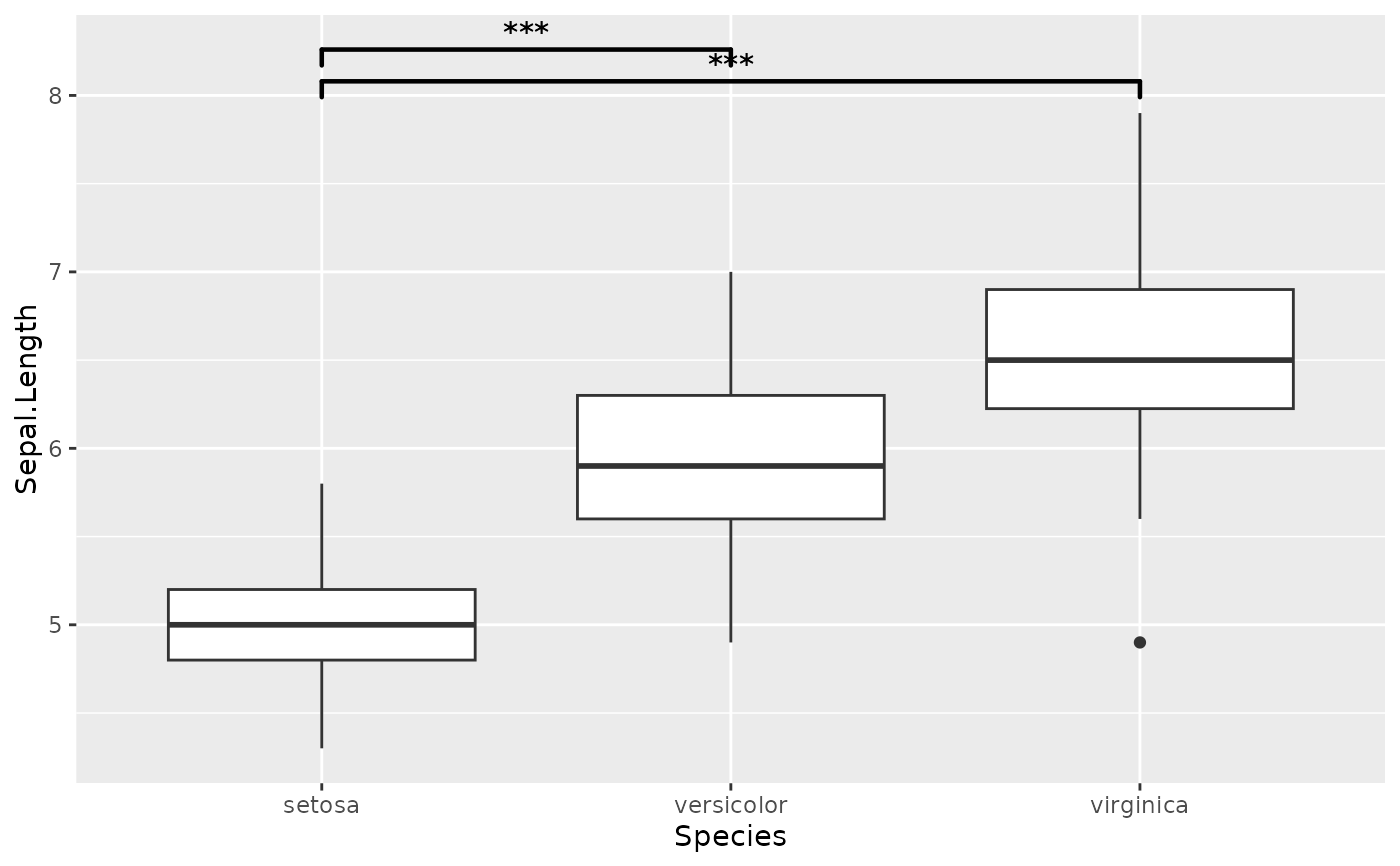
 # Custom comparisons
fmt_com(p, com_method = list(c("setosa", "virginica"), c("setosa", "versicolor")))
# Custom comparisons
fmt_com(p, com_method = list(c("setosa", "virginica"), c("setosa", "versicolor")))
 # Show p-value instead of stars
fmt_com(p, label = "p.format")
# Show p-value instead of stars
fmt_com(p, label = "p.format")
 # Show both p-value and stars
fmt_com(p, label = "{p.format}{p.signif}")
# Show both p-value and stars
fmt_com(p, label = "{p.format}{p.signif}")
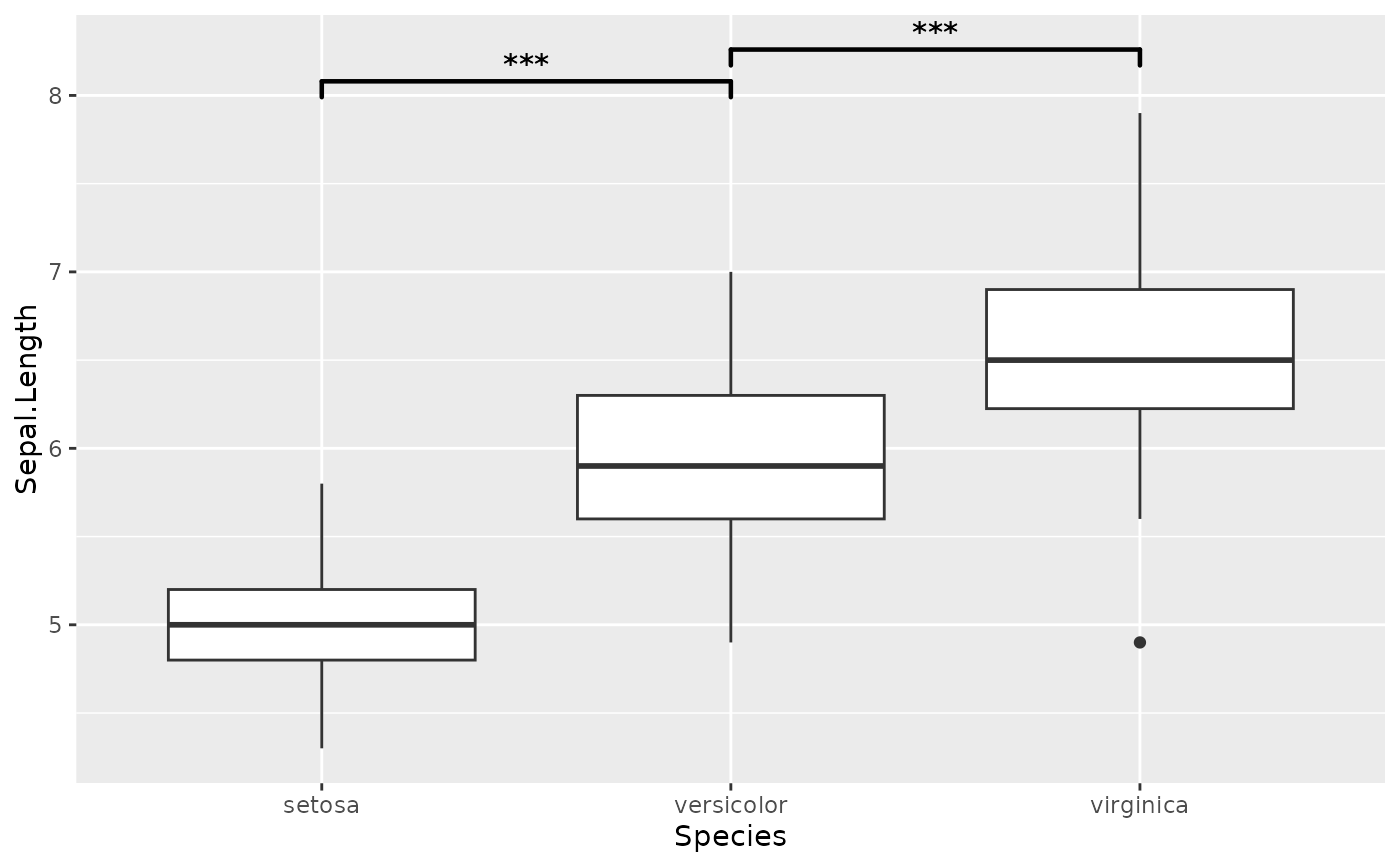
 # Adjust bracket y-position (absolute y-axis value, not proportion)
fmt_com(p, label.y = 8)
# Adjust bracket y-position (absolute y-axis value, not proportion)
fmt_com(p, label.y = 8)