Convenience wrapper that chains [fmt_axis()], [fmt_tag()], [fmt_legend()], and [fmt_ref()] in sequence. Each sub-formatter is applied only when its corresponding `*_list` argument is non-NULL.
Usage
fmt_plot(
  plot,
  fmt_axis_list = NULL,
  fmt_tag_list = NULL,
  fmt_legend_list = NULL,
  fmt_ref_list = NULL,
  plot.margin = NULL,
  tag_levels = NULL,
  axis_titles = NULL,
  ...
)
Arguments
- plot
A ggplot, patchwork, or list of ggplot objects.
- fmt_axis_list
Named list of arguments for [fmt_axis()]. Set to `NULL` (default) to skip.
- fmt_tag_list
Named list of arguments for [fmt_tag()]. Set to `NULL` to skip.
- fmt_legend_list
Named list of arguments for [fmt_legend()]. Set to `NULL` to skip.
- fmt_ref_list
Named list of arguments for [fmt_ref()]. Set to `NULL` to skip.
- plot.margin
Numeric vector of length 1 or 4, or a [ggplot2::margin()] object. Applied to all plots via `&`.
- tag_levels
Character string for patchwork tag levels (e.g. `"A"`, `"a"`, `"1"`). Only used when input is a patchwork object.
- axis_titles
Passed to [patchwork::plot_layout()] `axis_titles` argument. Only used when input is a patchwork object.
- ...
Currently unused.
See also
Other plot formatting:
fmt_axis(),
fmt_bg(),
fmt_boxplot(),
fmt_com(),
fmt_expand(),
fmt_his(),
fmt_legend(),
fmt_point(),
fmt_ref(),
fmt_scale(),
fmt_strip(),
fmt_tag()
Examples
library(ggplot2)
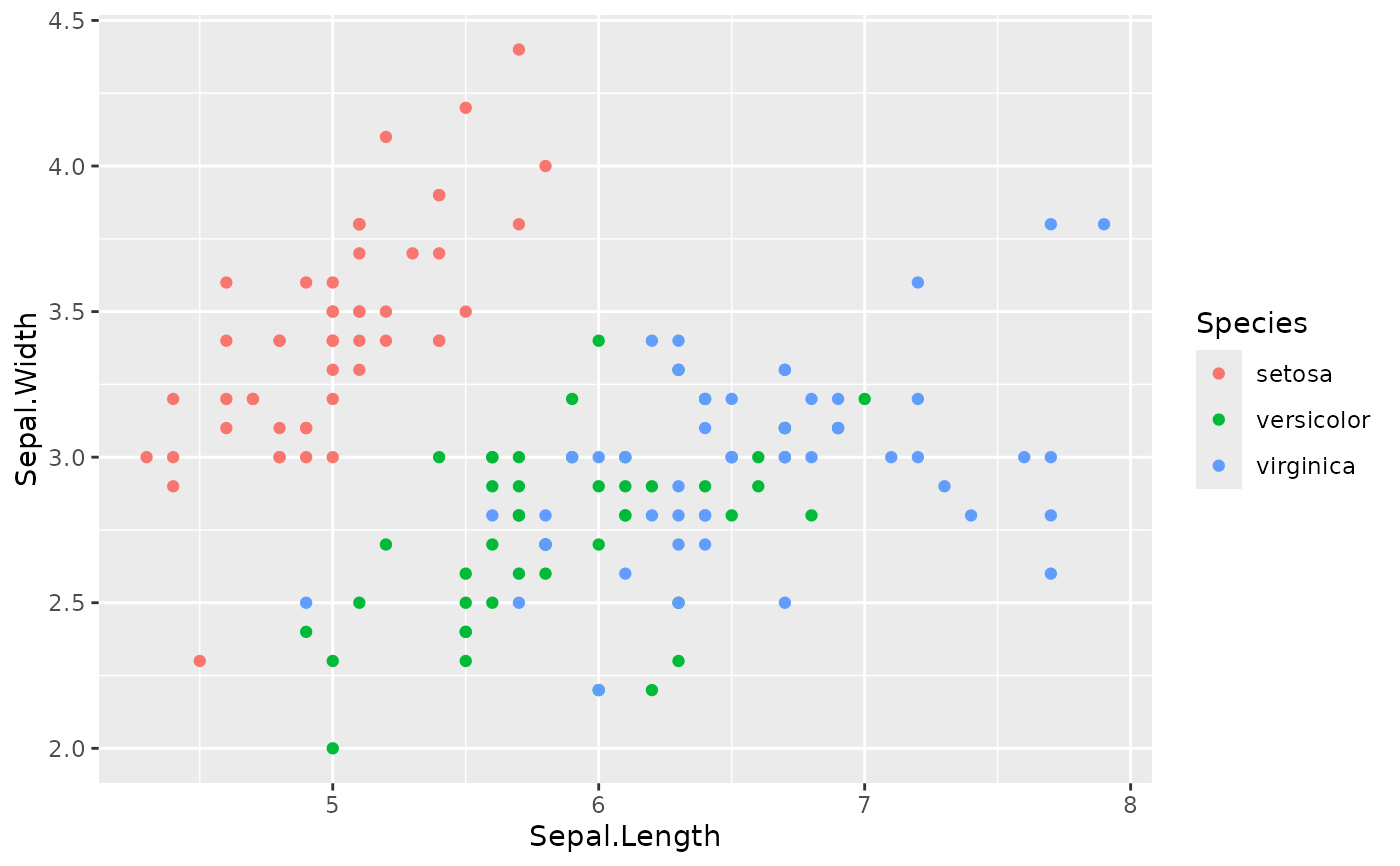
p1 <- ggplot(iris, aes(Sepal.Length, Sepal.Width, color = Species)) + geom_point()
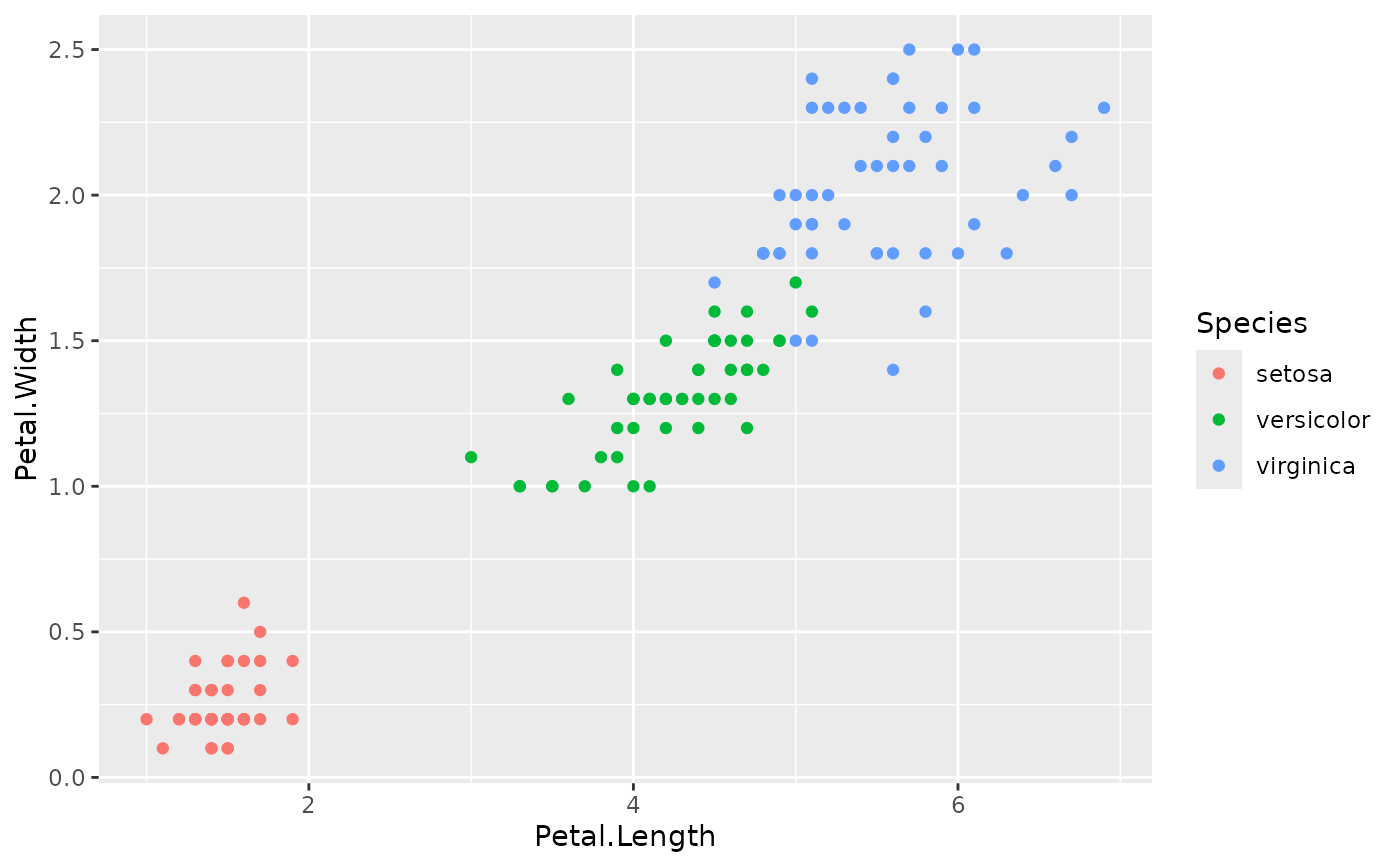
p2 <- ggplot(iris, aes(Petal.Length, Petal.Width, color = Species)) + geom_point()
# Single plot with reference line and legend
fmt_plot(p1, ref_x = 5.5, legend.position = "bottom")
 # Multi-plot with tags and merged legend
fmt_plot(list(p1, p2), tag = TRUE, merge_legends = TRUE)
#> [[1]]
# Multi-plot with tags and merged legend
fmt_plot(list(p1, p2), tag = TRUE, merge_legends = TRUE)
#> [[1]]
 #>
#> [[2]]
#>
#> [[2]]
 #>
#>